Monitoring and alerts
Distributed storage provides out-of-the-box monitoring metrics collection and alerting capabilities. After enabling monitoring and alerting, you can monitor and alert on storage clusters, storage performance, and storage components, and configure notification policies.
The intuitively presented monitoring data can be used to provide decision support for operations and maintenance inspections or performance tuning, and the comprehensive alerting and notification mechanisms will help ensure the stable operation of the storage system.
Tip: If monitoring and alerting were not enabled when creating the distributed storage, you will need to find alternative solutions for storage monitoring and alerting. For example, manually configuring monitoring panels and alerting policies in the operations center.
Monitoring
The platform defaults to collecting commonly used monitoring metrics such as read/write performance, CPU and memory usage for distributed storage. On the Monitoring tab of Storage > Distributed Storage, you can view real-time monitoring data for these metrics.
Storage overview
Monitor the health status of storage, physical capacity usage, and the number of active OSD/MON components. When the storage status is abnormal, you can view the alert reason.

Performance monitoring
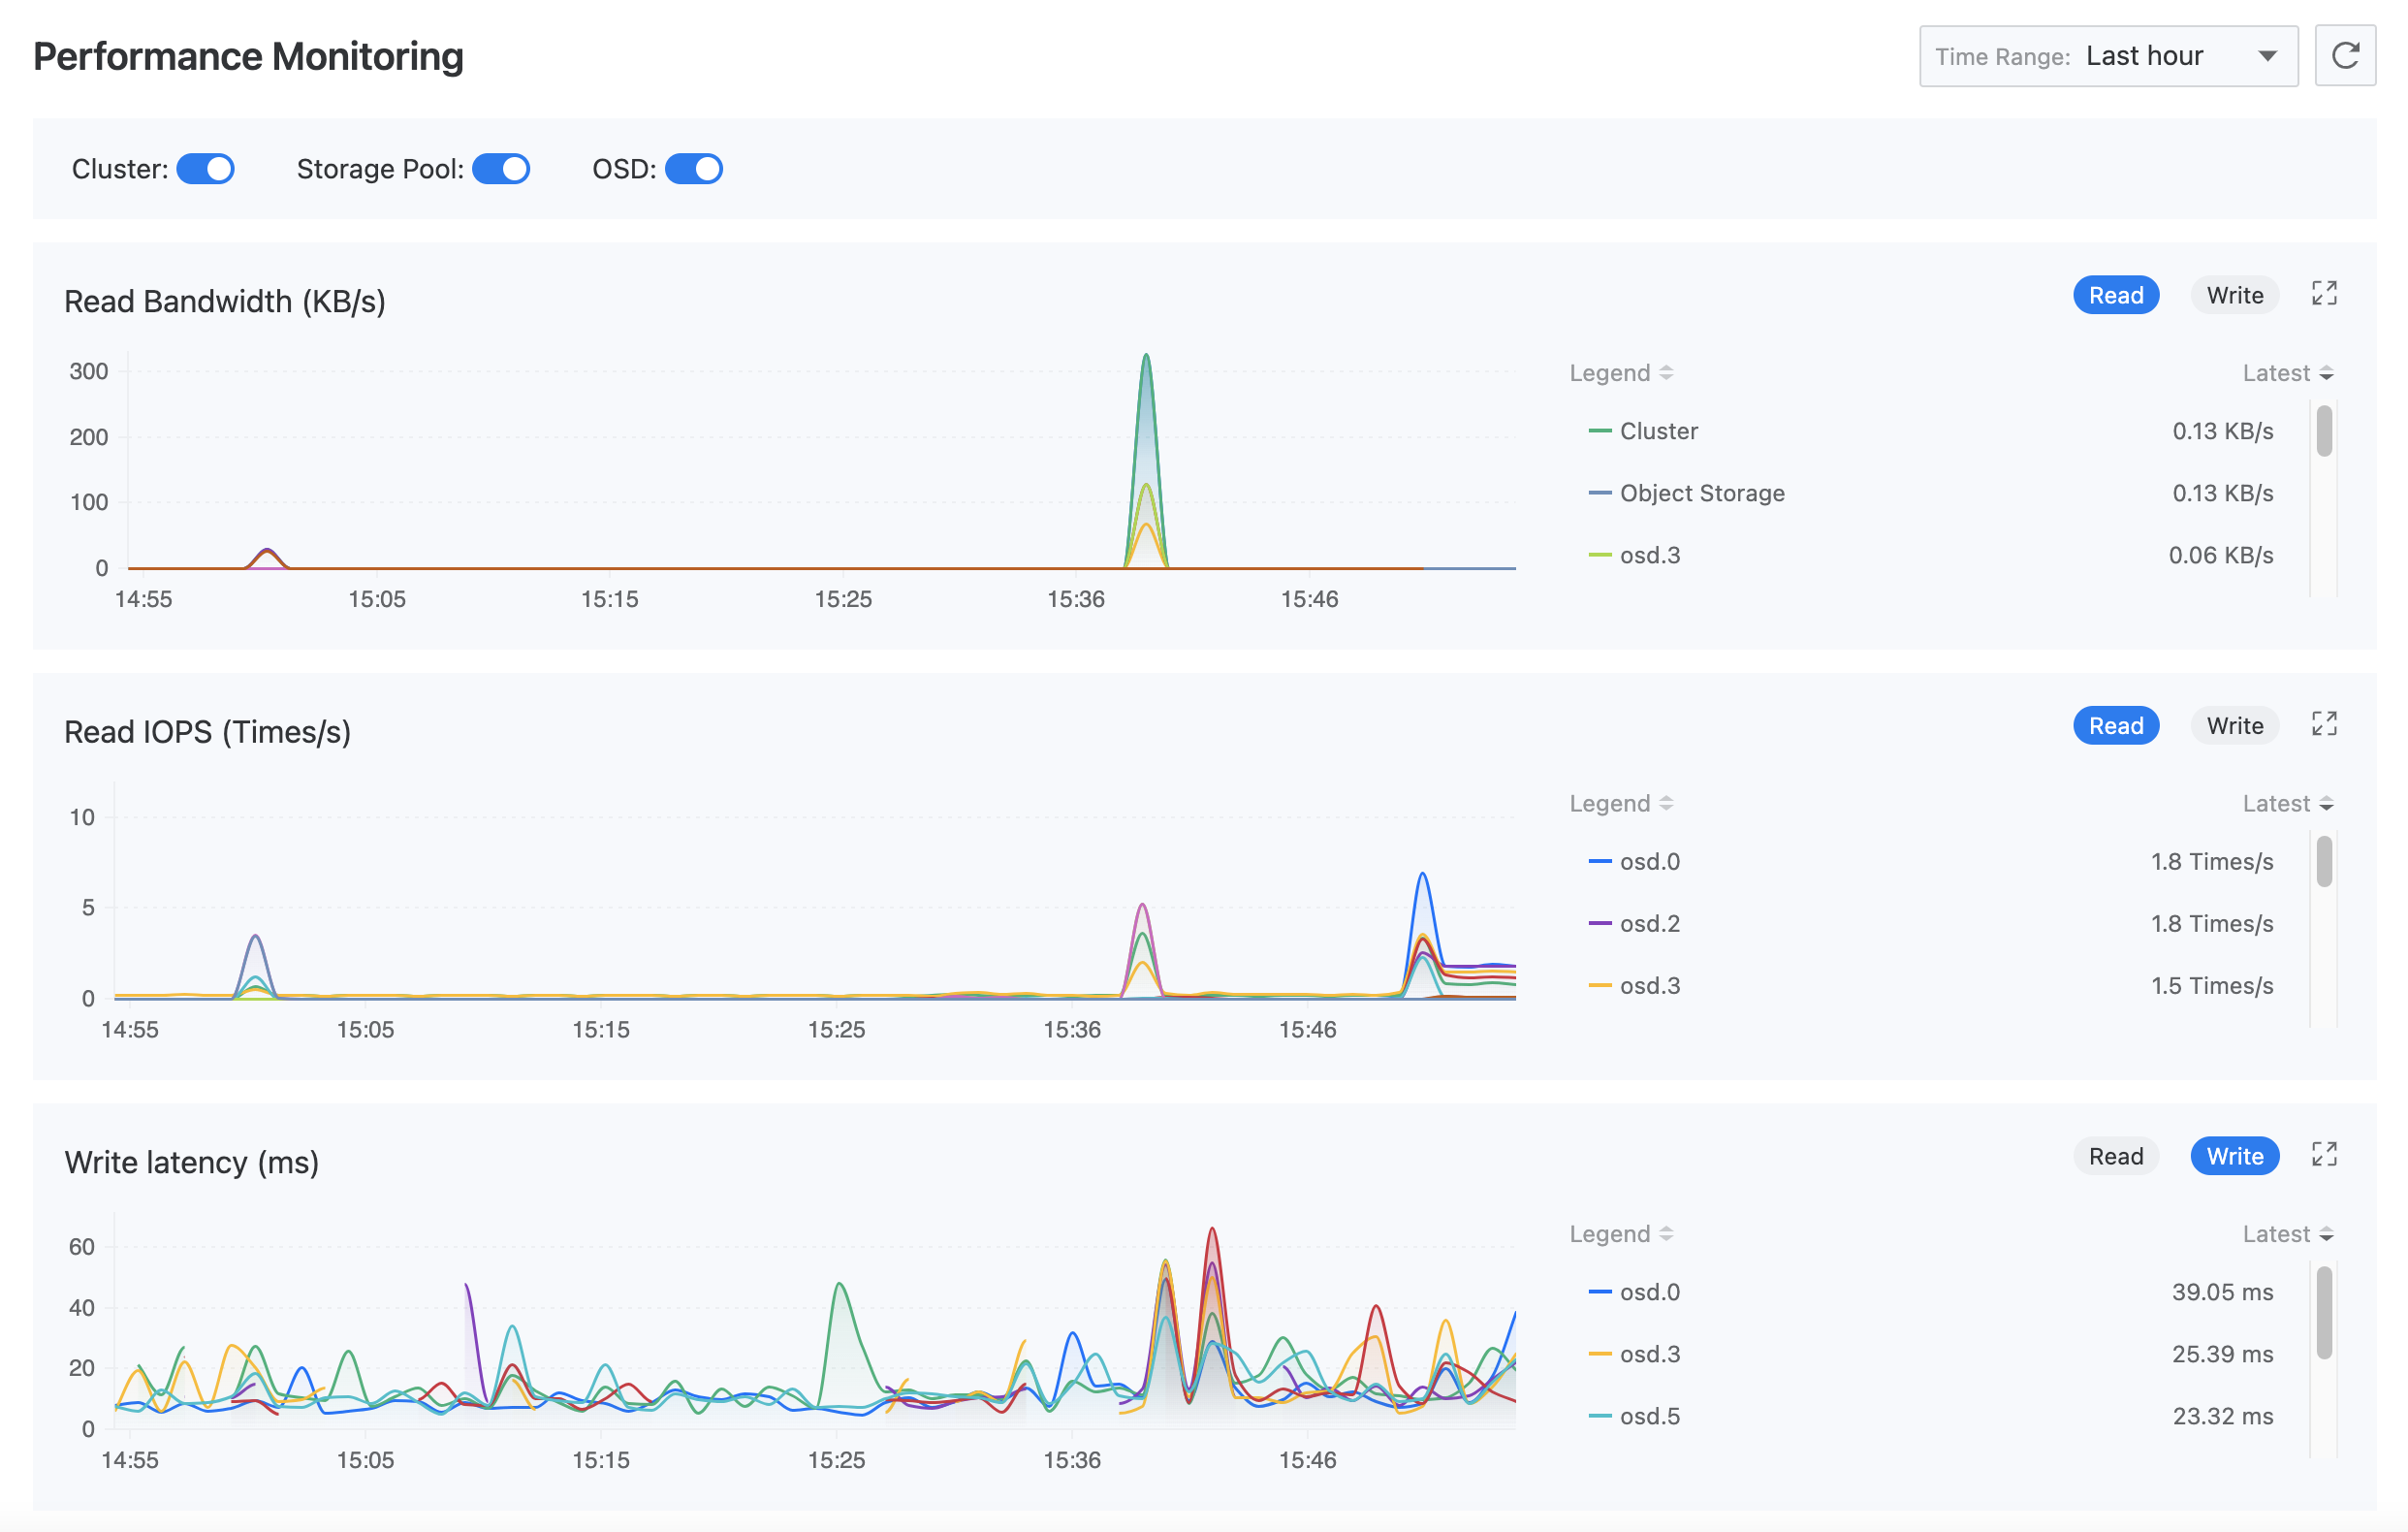
Monitor read/write bandwidth and read/write IOPS from the cluster, storage pool, and OSD dimensions. At the same time, you can monitor read/write latency for OSD.
Component monitoring
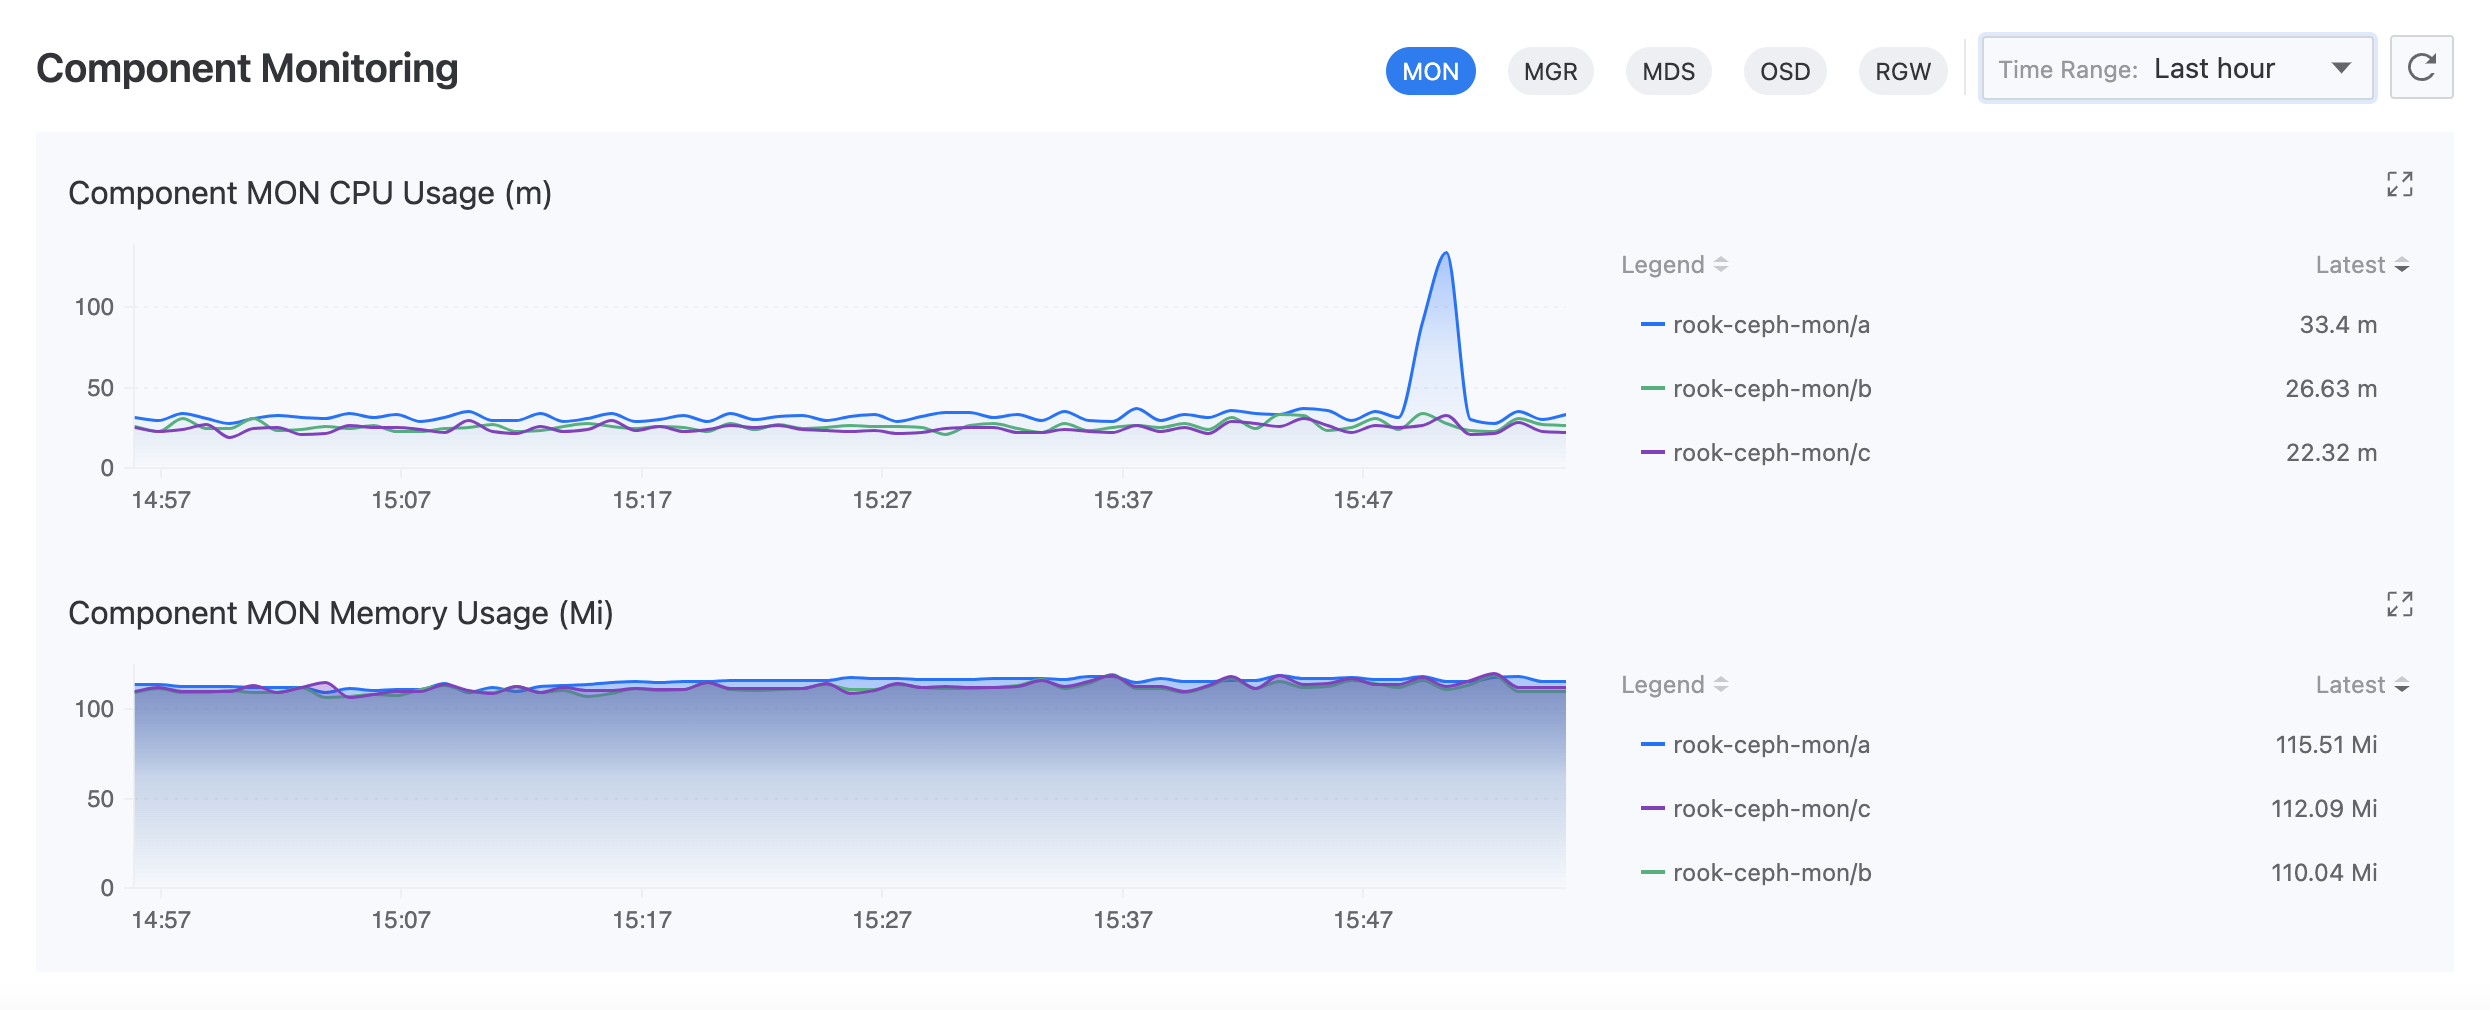
Monitor the CPU and memory usage of MON, OSD, and other components.
Alerts
The platform enables a set of default alert policies, which will automatically trigger alerts once resources are abnormal or monitoring data reaches the warning state. The preset policies can meet common operation and maintenance needs, such as component and cluster status alerts, device capacity alerts, and user data alerts.
Configuration notification
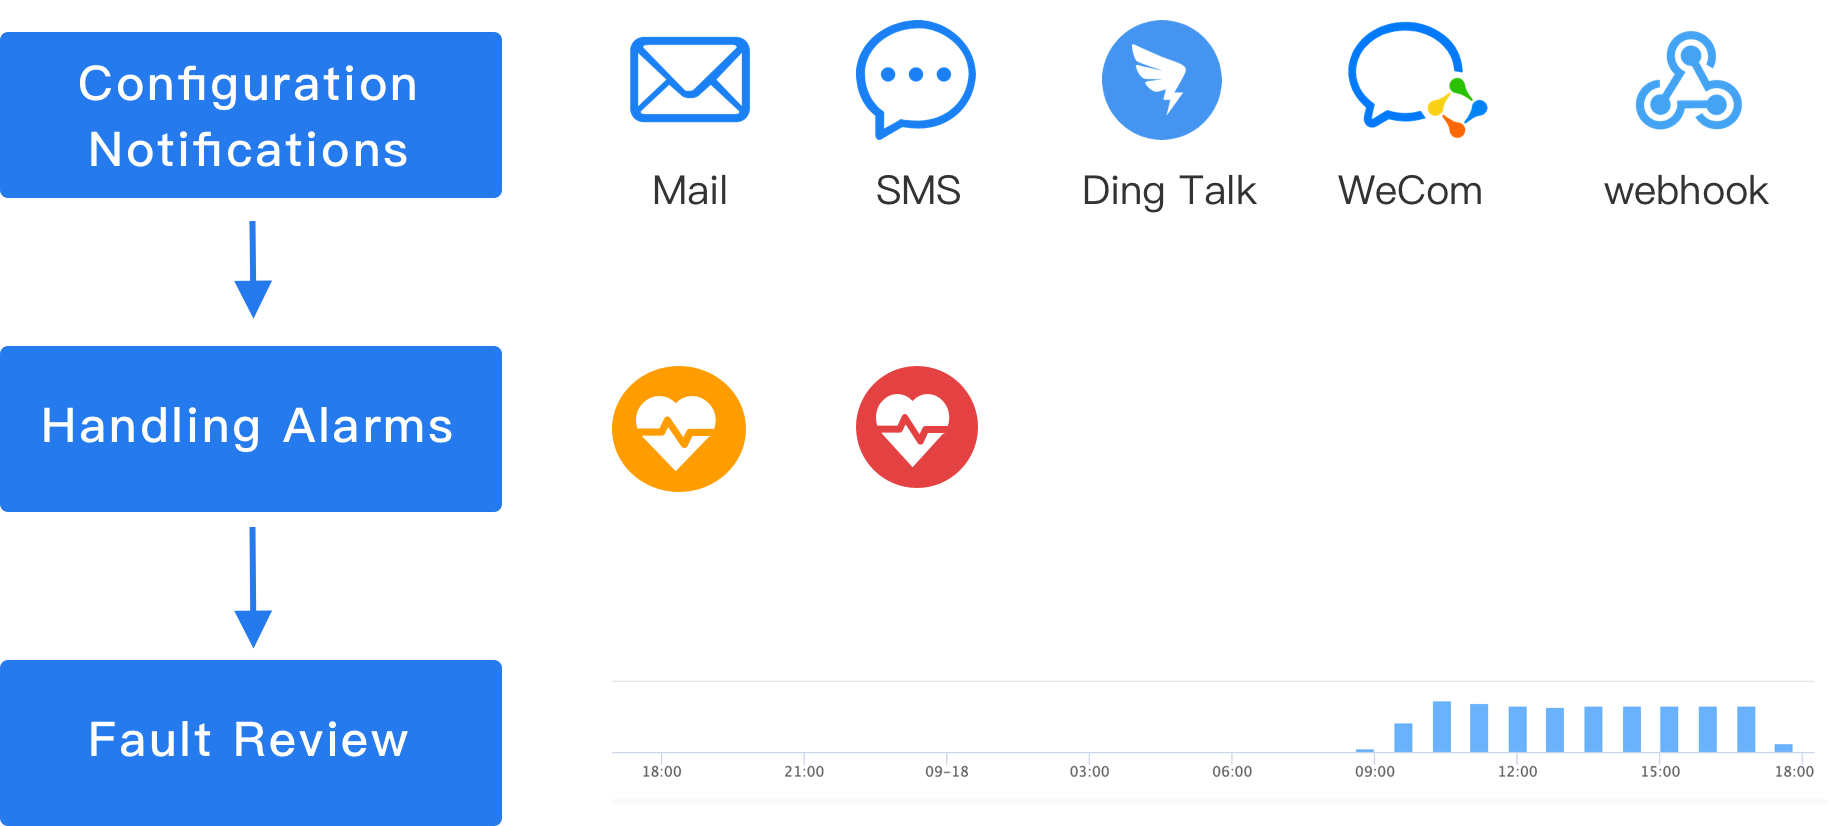
To receive alerts in a timely manner, it is recommended that you set up notification policies in the Operations Center. This will send alert information to relevant personnel via email, SMS, etc., reminding them to take necessary measures to solve problems or avoid faults. Click on  to switch to the Operations Center to complete the operation. Refer to
Creating Alert Policies
for more information.
to switch to the Operations Center to complete the operation. Refer to
Creating Alert Policies
for more information.
Handle alerts
-
If the storage cluster is in an “Alert” state, it means that an alert has been triggered and the related exception may cause a fault. Please check the details in Realtime Alerts in a timely manner and locate and troubleshoot the problem based on the cause of the fault.
-
If the storage cluster is in a “Fault” state, it means that the storage cluster is no longer running normally. Please locate and troubleshoot the problem immediately.
The following table shows the meaning of the alert levels used in the preset policies, which can serve as a reference for you to formulate alert handling principles.
| Alert Level | Meaning |
|---|---|
| Critical | The resource corresponding to the alert rule has a fault, which causes platform business interruption, data loss, and has a significant impact. |
| Height | The resource corresponding to the alert rule has a known issue, which may cause platform function failure and affect normal business operation. |
| Medium | There is a risk of running issues with the resources corresponding to the alarm rules. If not handled in a timely manner, it may affect normal business operations. |
Fault review
History records all alarms that have been triggered and are no longer in need of processing. When using alarm history for fault analysis, in order to effectively achieve the goal of summarizing experience, you may need to answer the following questions:
-
What were the specific abnormal conditions when the incident occurred?
-
If a certain alarm in the alarm list repeatedly appears, is there a pattern to follow? Can it be avoided before it happens again?
-
If the timeline shows a significant increase in alarms during a certain period of time, was it caused by an irresistible force or an operational accident? Is it necessary to adjust the operational plan?