Create an alarm policy
Based on the platform, monitoring, logging, event data, and combined with the platform’s notification feature, create metric alerts, custom alerts, log alerts (workloads only), event alerts (workloads only), and black box alerts (clusters only) for clusters, cluster nodes, workloads, and services. When the resources targeted by the alert policy experience anomalies or the monitoring data reaches the warning state set by the rules, the alert will be triggered automatically and alert notifications will be sent.
Prerequisites
-
To configure automatic notification policies for alerts, please configure notifications in advance.
-
Ensure that the cluster for which you want to create alert policies has deployed monitoring components so that alert policies based on metrics can take effect.
-
Ensure that the cluster for which you want to create alert policies has deployed log storage components and Log Agents so that alert policies based on log and event query results can take effect.
-
To create alert policies based on black box monitoring items, please create black box monitoring items in advance.
Basic Information
-
In the left-hand navigation pane, click Operations center > Alerts > Rules.
Tip: You can switch the target cluster using the top navigation bar.
-
Click Create an alarm policy.
-
In the Basic Information section, configure the basic information of the alert policy.
Parameter Description Alert Type - Resource Class Alert Alert types categorized by resource type. For example, selecting all deployments in a specified namespace and adding matching rules allows you to trigger an alert when the deployment status is not Running.
Tip:
- If some relevant parameters in certain resource objects are not selected, they default to Any. When you subsequently delete/add resource objects, the platform will correspondingly disassociate/associate alert policies;
- If you select Select All, it only applies to the currently selected resources, and when you subsequently delete/add resource objects, no action will be taken.
- If multiple namespaces are selected for some resource objects, only input is supported for Resource Name/Service/Instance Name, and regular expressions are supported, for example,cert.*.Alert Type - Event Class Alert Alert types categorized by specific events. For example, specifying Pods named Nginx in a namespace and adding matching rules allows you to trigger an alert when the Pod status is Failed.
Tip: When no matching rules are selected in the matching criteria, all resources under a certain resource will be selected by default, and when you subsequently delete/add resources, the platform will correspondingly disassociate/associate alert policies.
Alert condition
Resource alerts
-
In the Alert condition section, click Add Alert Rule.
Note: The numerical values displayed above the dialog are determined by metrics and aggregation time and will change in real-time based on your selection.
-
Select the alert type and configure the alert rule following the instructions below.
Parameter Description Expression Add custom metric rules according to your specific monitoring scenario to meet advanced monitoring alert requirements. Manually input Prometheus-recognized metric algorithms and indicators, for example: “rate(node_network_receive_bytes{instance="$server”,device!~“lo”}[5m])". Metric Unit The unit of metrics, you can manually enter a custom unit. Legend Parameters To facilitate displaying and viewing data on the legend, you can input a key of the monitoring data as the legend identifier. Input format like: {{.key}}.
Tip: After inputting the correct expression, move the cursor over the ranking statistics list on the top right of the dialog above the monitoring chart to view all the labels for the data. As shown in the image below.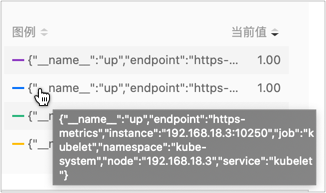
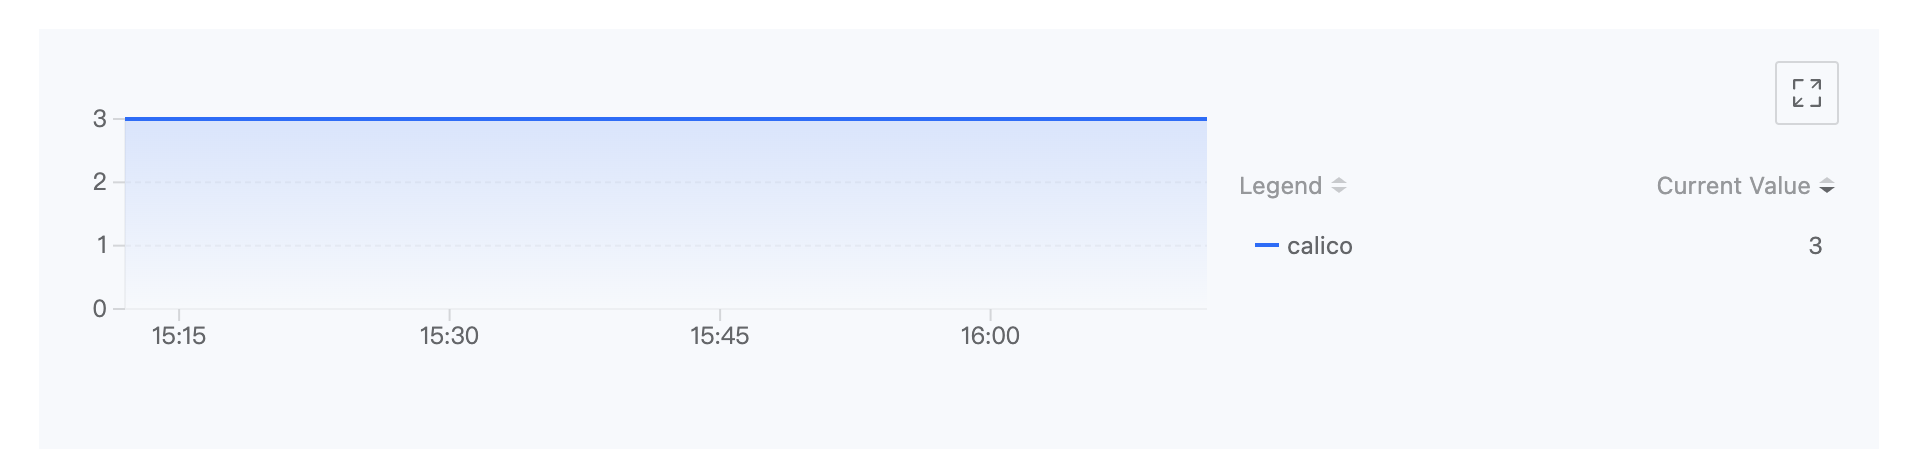
For example, using the expressionup{service="kubelet"}retrieves monitoring data with labels including"__name__":"up","endpoint":"https-metrics","instance":"192.168.18.2:10250","job":"kubelet","namespace":"kube-system","node":"192.168.18.2","service":"kubelet". If you want to use the target endpoint of the collected data as the legend identifier, you can input the legend parameter{{.instance}}. The display effect is shown in the image below.
Time Range The time range for log/event queries.
For example: If the time range is set to 5 minutes, after the alert is created, if the number of logs/events that meet the criteria is reached within any 5-minute period, the alert is triggered.Log Content Log content query fields (e.g., Error), confirmed by pressing Enter.
Supports inputting multiple fields, and when querying, the relationship between multiple fields is “and,” meaning that the log record must contain all the fields to match the query criteria.Event Reason Event reason query fields (Reason, e.g., BackOff, Pulling, Failed, etc.), confirmed by pressing Enter.
Supports inputting multiple fields, and when querying, the relationship between multiple fields is “or,” meaning that any field in the event reason can match the query criteria.Black Box Monitoring Item Only supports selecting black box monitoring items created under the current cluster. Display format: Black Box Monitoring Item Name (Target Address). Metric Name Metric Alert: The metric name is the name of the platform’s predefined metrics.
Custom Alert: The metric name is the name of user-defined metrics.
Black Box Alert: When the Detection Method of the selected black box monitoring item isICMPorTCP, the metric name is displayed asConnectivity(Metric Name), and cannot be set; when the Detection Method isHTTP, the metric name can be selected asConnectivity(Metric Name) orcluster.blackbox.http.status.code(HTTP Status Code).Trigger Condition The Trigger Condition is a judgment condition composed of comparison operators, alert thresholds, and duration (optional). It determines whether an alert is triggered based on the comparison result between the real-time value of metrics/logs/events and the alert threshold, as well as the duration in which the real-time value remains within the alert threshold range.
Comparison Operators: > (greater than), >= (greater than or equal to), == (equal to), <= (less than or equal to), < (less than), != (not equal to).
Alert Threshold: The alert threshold only accepts numbers. When the Detection Method of the selected black box monitoring item isHTTPand the Metric Name is selected ascluster.blackbox.http.status.code, the alert threshold is the HTTP request’s response status code and only supports entering a 3-digit positive integer, for example: 200.
Duration: When the real-time value of metrics data remains within the alert threshold range for the specified duration, the alert is triggered.Alert Severity The alert severity of the alert rule, set by the user. Users can set a reasonable alert severity based on the impact of the alert rule on the corresponding resources and the impact on the business.
Disaster Alert: The resource corresponding to the alert rule fails, leading to platform business interruption and data loss, with a significant impact. For example, the health status value of a node has been 0 (down) for 3 minutes.
Severe Alert: The resource corresponding to the alert rule has known issues that may lead to platform function failure and affect normal business operation. For example, the number of available Pods for workloads has been 0 for 3 minutes.
Warning Alert: The resource corresponding to the alert rule has operational risks, which may affect normal business operation if not addressed in a timely manner. For example, the node CPU usage rate has exceeded 80% for 3 minutes.
Information Alert: The resource corresponding to the alert rule has expected issues, which do not affect business operation in the short term but carry potential risks. For example, the node CPU usage rate has exceeded 70% for 3 minutes. -
Click Add.
Event Alerts
-
In the Alert condition section, click Add Alert Rule and configure the alert rule following the instructions below.
Parameter Description Time Range The time range for event queries.
For example: If the time range is set to 5 minutes, after the alert is created, if the number of events that meet the criteria is reached within any 5-minute period, the alert is triggered.Event Monitoring Item The severity or event reason of the selected event to monitor.
- Event Severity: The severity defined by the selected event, such as Warning.
- Event Reason: The specific reason for the event (Reason, e.g., BackOff, Pulling, Failed, etc.), confirmed by pressing Enter. Supports inputting multiple fields, and when querying, the relationship between multiple fields is “or,” meaning that any field in the event reason can match the query criteria.Trigger Condition The trigger condition is judged using comparison operators. It judges whether an alert is triggered based on the comparison result of the event count of metrics. Alert Severity The alert severity of the alert rule, set by the user. Users can set a reasonable alert severity based on the impact of the alert rule on the corresponding resources and the impact on the business.
Disaster Alert: The resource corresponding to the alert rule fails, leading to platform business interruption and data loss, with a significant impact. For example, the health status value of a node has been 0 (down) for 3 minutes.
Severe Alert: The resource corresponding to the alert rule has known issues that may lead to platform function failure and affect normal business operation. For example, the number of available Pods for workloads has been 0 for 3 minutes.
Warning Alert: The resource corresponding to the alert rule has operational risks, which may affect normal business operation if not addressed in a timely manner. For example, the node CPU usage rate has exceeded 80% for 3 minutes.
Information Alert: The resource corresponding to the alert rule has expected issues, which do not affect business operation in the short term but carry potential risks. For example, the node CPU usage rate has exceeded 70% for 3 minutes. -
Click Add.
Configuration of policy
In the Configuration of policy section, you can set up automated actions triggered by alerts, such as automatically sending alert notifications.
-
Click the dropdown menu for Notification rules, and select one or more notification policies already created in the platform.
-
Choose the alert sending interval, configuring the time interval for sending alert messages from the moment of triggering to recovery from the alert.
-
Global: Select to use the platform’s global default configuration. The global configuration can be updated, see Update Alert Sending Interval .
-
Custom: Select Custom to have the option to choose the time interval for sending alert messages for each alert level by clicking the dropdown menu to the right of the alert level.
Note: When selecting Non-repetitive, only one alert message will be sent upon alert triggering and another upon alert recovery.
-
-
Click Create.
Relevant operations
You can click on the right-hand side  in the list page or the Operations in the upper right corner of the details page to update or delete alert policies as needed, or to set them as silent.
| Operation | Description |
|---|---|
| Disable/enable alarm rules | For flexible management of rules under policies, the platform supports disabling/enabling rules in created alert policies. When disabled, the rule’s status becomes “-”, and it does not count towards the total number of rules in the alert policy. When re-enabled, the conditions for triggering alerts in the rule will become active again. |
| Delete an alert rule | Supports deleting alert policies that are no longer needed. Once a policy is deleted, alerts cannot be triggered through the rules in the policy.
|