Dashboard
A dashboard is a collection of one or more charts that are organised and arranged in one or more rows to provide an at-a-glance view of relevant information. These pannels can query raw data from a data source and transform it into a series of visualisations supported by the platform.
Interface Overview
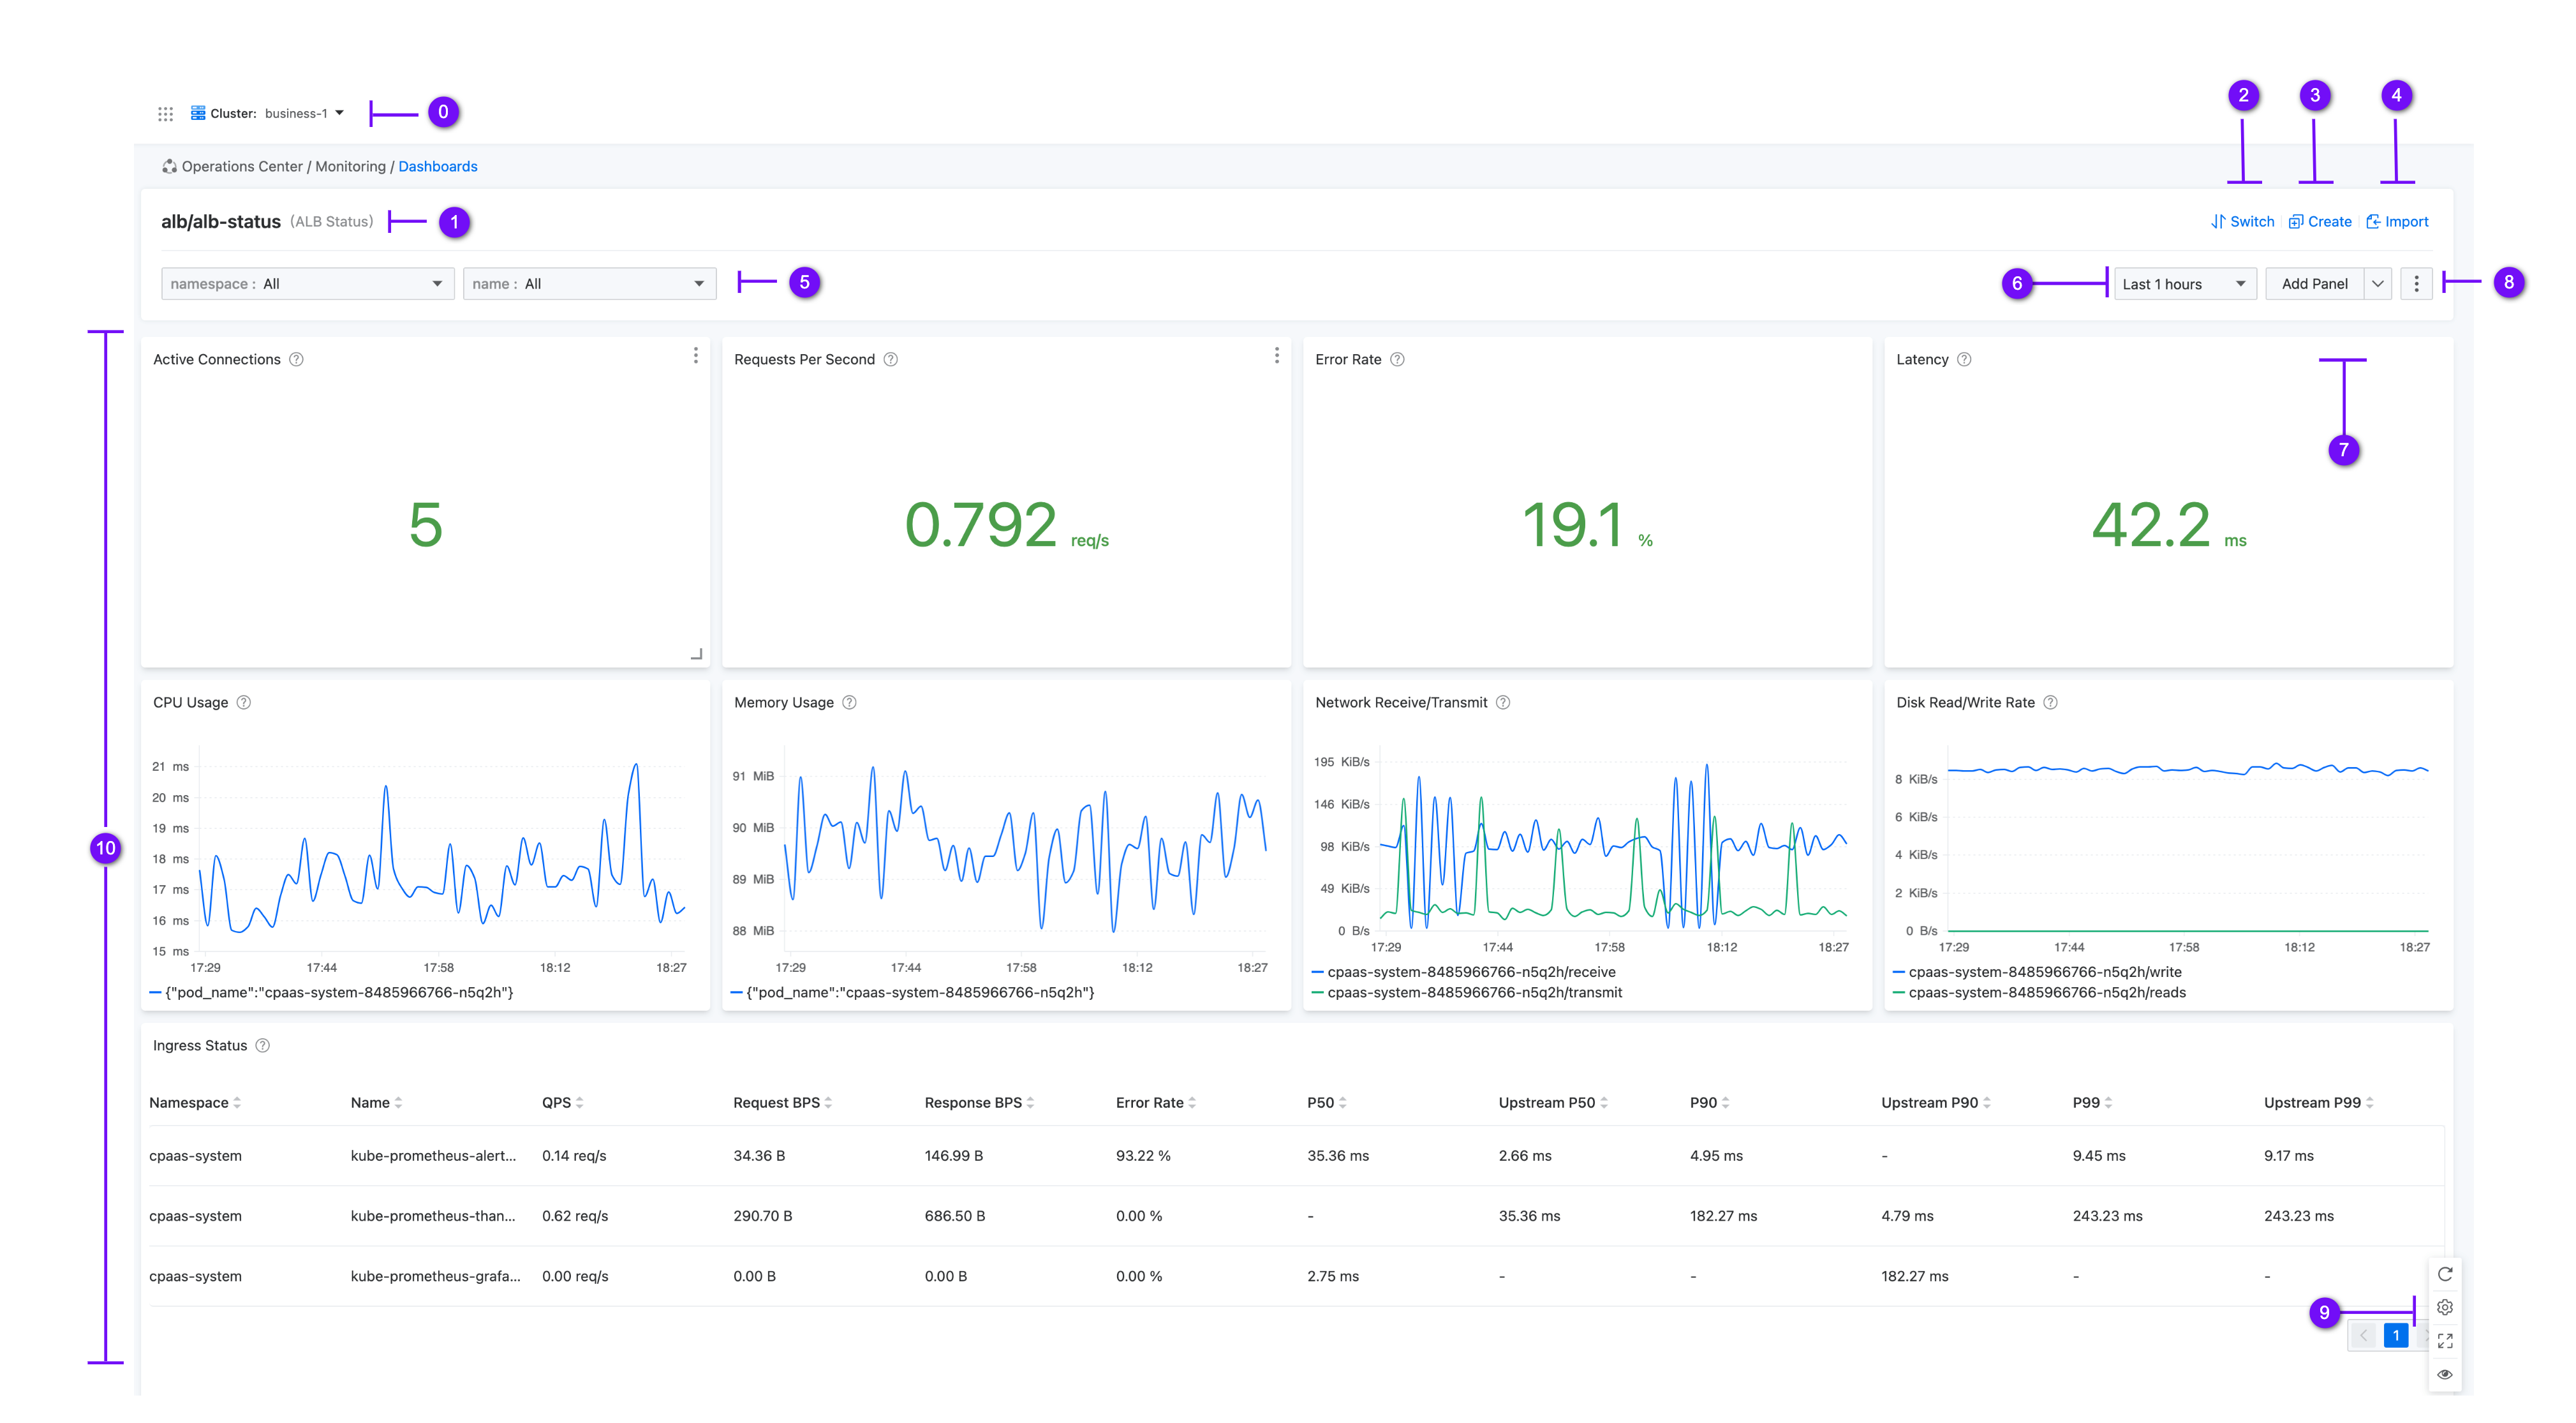
| serial | instruction | reference document |
|---|---|---|
| 0 | Toggle to view dashboards managed by different clusters | - |
| 1 | The path and name of the file where the current dashboard is located, displayed in the format: folder name/panel name. The same folder can contain multiple dashboards. | - |
| 2 | Toggle to show other dashboards, | switching panel |
| 3 | Create a new custom dashboard. | Create a dashboard |
| 4 | Import the grafana dashboard as a custom monitor dashboard. | Import Dashboard |
| 5 | Variables area, where variables can be toggled to view different data within the pannel. | - |
| 6 | Displays the time range of the data. | - |
| 7 | Add Dashboard button to add multiple data dashboards in a customised pannel to customise your own monitoring dashboard. | Add Pannels , Add Rows |
| 8 | Dashboard operation area to support editing, copying, setting or deleting operations on custom dashboards. | Other operations |
| 9 | The side quick configuration buttons, from top to bottom, are the Refresh Pannel Data button, Configure Auto Refresh Data Time button, Full Screen button, and Quick View Icon Data button. | - |
| 10 | Monitor the content area of the dashboard. | - |
Dashboard Related Operations
Create a dashboard
-
Click Create Dashboard and refer to the following instructions to configure the relevant parameters.
parameters instruction folders The folder where the dashboard is located can be entered or selected from an existing folder. labels Monitor dashboard labels to quickly find created dashboards when switching between dashboards by filtering by the top label. Setting up the main dashboard If enabled, this dashboard will be configured as the main dashboard when the creation is completed; when you enter the Monitor Panel function again, the main dashboard data will be displayed by default. variable Variables are added during the creation of the dashboard so that they can be referenced as indicator parameters in the added pannel, and can be filtered as filters in the panel home page -
After adding, click Create to complete the creation of the dashboard. Next you need to Add Variables, Add Pannel, and Add Row to complete the layout design of the whole page.
Import Dashboard
The platform supports direct import of Grafana Json for conversion to and presentation of the platform’s dashboards.
-
Currently only V8+ versions of Grafana Json are supported for import, lower versions of Grafana Json will be disabled.
-
After the dashboard is imported, if one of the charts is not supported by the platform, it may be displayed as Unsupported Chart Types but you can modify the settings of the chart to display it normally.
-
After the dashboard is imported you can perform any management action normally, and there is no difference with the dashboard created by the platform.
Adding Variables
-
In the Variables form area, click Add.
parametric instruction typology Currently only the Query type of variable is supported, which allows you to filter the data based on the characteristic dimensions of the time series. And dynamically calculate and generate query results by specifying query expressions. Show filters Used to show the default value of the dropdown filter item on the dashboard’s home page, supports displaying the name and value, the value, or not displaying it, and will hide the filter box when not displaying it. Query Settings Using variables of the Query type allows you to filter the data according to the characteristic dimensions of the time series. When defining query settings, in addition to querying the time series for query settings using PromQL, Grafana provides a number of commonly used variables and functions, see Common Functions and Variables . regular expression (math.) Using regular expressions, you can filter the values you need from what is returned by a variable query. Make the name of each option contained in the variable more consistent with expectations, and you can see in real time in the Variable Value Preview if the filtered value is as expected. Selection of settings - multiple choice:Allows multiple options to be selected at the same time when selected in the top filter item on the dashboard home page. You need to reference the variable in the query expression of the pannel in order to view the data corresponding to the variable value in the pannel.
- ALL:Checking this will enable an option containing All in the filter item for selecting variable data in full. -
Click OK to add one or more variables.
Add Pannel
Add multiple dashboards to the currently created monitor pannel for displaying data information about different resources.
Hint: Mouse click on the lower right corner of the pannel can be customised by dragging the chart size; click on any position of the chart can be customised by dragging the chart arrangement order.
-
Click Add Pannel and refer to the instructions below to configure the relevant parameters.
district instruction Pannel Preview In the pannel preview area the data information corresponding to the added indicator will be displayed in real time. Adding Indicators Configure parameters such as pannel title and monitoring indicators in this area. - Add method:Support the use of built-in indicators or the use of native custom indicators, the two ways to add will take the concatenation, effective at the same time.
- Built-in indicators:Select the common indicators built into the platform as well as the legend parameters for displaying information about the data under the current pannel.
Note:Indicator units must be uniform for all indicators added to a pannel; it is not possible to add indicators with more than one unit to a pannel. - protozoa:Custom metric units, metric expressions and legend parameters, metric expressions follow PromQL syntax,For more information, please refer to [Official Documentation].( https://prometheus.io/docs/prometheus/latest/querying/basics/ )。
- Legend parameters:Controls the names corresponding to the curves in the pannel, either in the form of text or templates;
Rule: The input value must be in{{.xxxx }}format, e.g.{{.hostname}}. will be replaced with the value corresponding to the hostname label of the expression’s return value.
Hint:When a wrongly formatted legend parameter is entered, the names corresponding to the curves in the pannel will be displayed in their original format.
- Instant:When the Instant switch is on, instantaneous values are queried and sorted through Prometheus’ Query interface, e.g., statistical graphs, measurement graphs; if it is off, calculations are made using query_range, i.e., querying a range of data over a certain time period.
Chart Settings Supports the selection of different pannel types to visualise the data information of the indicator, see Chart Options. -
Click Save to finish adding the pannel.
-
You can add one or more dashboards within the pannel.
-
Once you have finished adding the pannel, you can use these two actions to ensure that the presentation and size of the pannel will meet your expectations.
-
Click on the bottom right corner of the pannel to customise the drag chart size.
-
Click and drag anywhere on the pannel to customise the order of the pannel.
-
5.When the adjustment is complete, click the Save button on the dashboard page to save your changes this time.
Add Rows
Rows are logical dividers in the dashboard that group pannels together.
-
Click Add Pannel in the drop-down menu > Add Row and refer to the following instructions to configure the relevant parameters.
district instruction Row Name of the subgroup. repeating Support for variables that disable repeating or selecting the current pannel:
- Disable Repet:No variables are selected, the grouping created by default is used.
- parametric variable:By selecting the variable created in the current pannel, the monitor dashboard will generate a row of identical subgroups for each grouping based on the value of the variable, and each subgroup will be displayed using the variable value. Subgrouping does not support modifying, deleting, or moving dashboards. -
Once you have added the grouping, you can perform the following actions on the grouping to manage the display of the charts within the dashboard.
-
Groupings can be stowed or expanded to hide parts of the dashboard. Dashboards within the stowed grouping will not issue queries.
-
Moving a pannel to a grouping makes the pannel managed by that grouping. The group will manage all pannels from it to the next group.
-
When the group is folded, the position can be moved together with all the dashboards managed in the group.
-
The folding and tucking of the grouping is also an adjustment to the dashboard, if you want the grouping to need to remain in this state the next time you open this layout, click the Save button.
-
switching panel
Set the created custom dashboard as the main dashboard, when you enter the dashboard function again, the main dashboard data will be displayed by default.
-
In the left navigation bar, click Operation and Maintenance Centre > Monitoring > Monitoring Dashboard.
-
To enter the main dashboard of monitoring by default, click Toggle Dashboard.
-
Dashboards can be found by filtering by label or searching by name, and the main panel can be switched by the Main Panel switch.
Other operations
You can do this on the dashboard page by clicking on the right-hand side of the  ,operation of the dashboard on demand。
| operation | instruction |
|---|---|
| YMAL | The dashboard opens the CR resource code that is actually stored in the Kubernetes cluster, and you can modify everything inside the dashboard directly by modifying the parameters in the YAML. |
| Derived expressions | The metrics used in the current dashboard and the corresponding query expressions can be exported in CSV format |
| clone | Duplicate the current dashboard, edit the pannel as desired and then you can save it as a new panel. |
| setting | Modify the basic information of the current dashboard, such as modifying labels, adding more variables, etc. |
| removing | Delete the current monitor dashboard. |
Common Functions and Variables
Common Functions
When defining query settings, in addition to using PromQL query time series for query settings, We also provides some common functions, you can refer to the following functions to customise query settings.
| function (math.) | corresponds |
|---|---|
| label_names() | Returns all labels in Prometheus, e.g.: label_names() |
| label_values(label) | Returns all optional values labelled label for all of Promthues’s monitoring metrics, e.g., label_values(job) |
| label_values(metric, label) | Returns all optional values labelled label in the Promthues metric of all monitoring metrics, e.g.: label_values(up{}, job) |
| metrics(metric) | Returns the names of all metrics whose names satisfy the regular expression defined by metric, e.g.: metrics(cpaas_active) |
| query_result(query) | Returns the query result of a Prometheus query statement, e.g. query_result(up{}) |
Common Variables
When defining query settings, you can quickly customise variables by combining common functions into variables, the following provides you with some common variable definitions:
| variable name | query function | regular expression (math.) |
|---|---|---|
| cluster | - | - |
| node | label_values(node_load1, instance) |
/(.*?):.*/ |
| namespace | query_result(kube_namespace_labels) |
/.*namespace=\"(.*?)\".*/ |
| deployment | label_values(kube_deployment_spec_replicas{namespace="$namespace"}, deployment) |
- |
| daemonset | label_values(kube_daemonset_status_number_ready{namespace="$namespace"}, daemonset) |
- |
| statefulset | label_values(kube_statefulset_replicas{namespace="$namespace"}, statefulset) |
- |
| pod | label_values(kube_pod_info{namespace=~"$namespace"}, pod) |
- |
| vmcluster | label_values(up, vmcluster) |
- |
| daemonset | label_values(kube_daemonset_status_number_ready{namespace="$namespace"}, daemonset) |
- |
Variable Use Practice I
Use the query_result(query) function to query for the value: node_load5 and extract the ip.
-
Fill in
query_result(node_load5)in Query Settings. -
Variable value preview area, preview example
node_load5{container="node-exporter",endpoint="metrics",host_ip="192.168.178.182",instance="192.168.178.182:9100"}。 -
Fill in the regular expression with
/. *instance="(. *?) :. */to filter the value. -
Variable value preview area, preview example
192.168.176.163.
Variable Use Practice II
-
Add the first variable: namespace, use the query_result(query) function to query for the value:
kube_namespace_labels, and extract namespace.-
Query Settings:
query_result(kube_namespace_labels)。 -
Variable Value Preview
kube_namespace_labels{container="exporter-kube-state", endpoint="kube-state-metrics", instance="12.3.188.121:8080", job="kube-state", label_cpaas_io_project="cpaas-system", namespace="cert-manager", pod="kube-prometheus-exporter-kube-state-55bb6bc67f-lpgtx", project="cpaas-system", service="kube-prometheus-exporter-kube-state"}。 -
regular expression (math.):
/.*namespace=\"(.*?)\".*/。 -
Variable Value Preview area, the preview example contains several namespaces such as
argocdcpaas-system.
-
-
Add a second variable: deployment and reference the variable you just created:
-
Query Settings:
kube_deployment_spec_replicas{namespace=~"$namespace"} -
regular expression (math.):
/.*deployment="(.*?)",.*/。
-
-
Add a dashboard under this pannel and reference the variables you added earlier. Example:
-
The name of the metric is: Memory usage of container groups under the Compute component.
-
key-value pair:
kind:Deployment,name:$deployment,namespace:$namespace。
-
-
After adding a dashboard and saving it, you can view the corresponding dashboard information in the dashboard home page.
Considerations when using built-in indicators
Note:Custom variables used for the following indicatorsnamespace,name 和 kind,Does not support Multiple Choice or Choice All.
namespace Only the selection of specific namespaces is supported;name Only three types of calculation components are supported:deployment、daemonset、statefulset;kind Fill in support only Deployment、DaemonSet、StatefulSet One of three types.
-
workload.cpu.utilization -
workload.memory.utilization -
workload.network.receive.bytes.rate -
workload.network.transmit.bytes.rate -
workload.gpu.utilization -
workload.gpu.memory.utilization -
workload.vgpu.utilization -
workload.vgpu.memory.utilization