Configure OpenTelemetry (OTel)
OpenTelemetry (OTel) is an open-source project designed to provide a vendor-neutral standard for distributed systems (such as microservice architectures) to collect, process, and export telemetry data. It supports developers in analyzing software performance and behavior more easily, making it easier to diagnose and troubleshoot application issues.
Terminology
| Term | Explanation |
|---|---|
| Trace | Data submitted to the OTel Server, a collection of related events or operations used to track the flow of requests in a distributed system. Each Trace consists of multiple Spans. |
| Span | An independent operation or event within a Trace, containing start time, duration, and other relevant information. |
| OTel Server | The OTel server capable of receiving and storing Trace data, such as Jaeger, Prometheus, etc. |
| Jaeger | An open-source distributed tracing system used for monitoring and troubleshooting microservice architectures, supporting integration with OpenTelemetry. |
| Attributes | Key-value pairs attached to Traces or Spans to provide more contextual information, including Resource Attributes and Span Attributes. See Attributes for more details. |
| Sampler | A policy component that decides whether to collect and report Traces. Different sampling strategies can be configured, such as full sampling, proportional sampling, etc. |
| ALB (Another Load Balancer) | A software or hardware device that distributes network requests to available nodes in a cluster. The load balancer (ALB) used in the platform is a Layer 7 software load balancer that can be configured with OTel to monitor traffic. ALB supports submitting Traces to a specified Collector, supports different sampling strategies, and can configure whether to submit Traces at the Ingress level. |
| FT (Frontend) | ALB port configuration, specifying port-level configurations. |
| Rule | Routing rules on the port (FT) used to match specific routes. |
| HotROD (Rides on Demand) | A sample application provided by Jaeger to demonstrate the use of distributed tracing. For more details, see Hot R.O.D. - Rides on Demand . |
| hotrod-with-proxy | Specifies the addresses of various microservices inside HotROD through environment variables. See hotrod-with-proxy for more details. |
Prerequisites
-
Ensure an operational ALB exists: Create or use an existing ALB, with its name replaced by
<otel-alb>in the document. For details on creating an ALB, refer to Create Load Balancer . -
Ensure the existence of a server address for OTel data reporting: This address will hereafter be referred to as
<jaeger-server>.
Steps
Update ALB Configuration
-
On the Master node of the cluster, use the CLI tool to execute the following command to edit the ALB configuration.
kubectl edit alb2 -n cpaas-system <otel-alb> # Replace <otel-alb> with the ALB name -
Add the following fields under the
spec.configfield.otel: enable: true exporter: collector: address: "<jaeger-server>" # Replace <jaeger-server> with the server address for OTel data reporting request_timeout: 1000Sample configuration:
spec: address: 192.168.1.1 config: otel: enable: true exporter: collector: address: "http://jaeger.default.svc.cluster.local:4318" request_timeout: 1000 antiAffinityKey: system defaultSSLCert: cpaas-system/cpaas-system defaultSSLStrategy: Both gateway: ... type: nginx -
Execute the following command to save the update. Once updated, the ALB will enable OpenTelemetry by default and report all request Trace information to the Jaeger Server.
:wq
Related Operations
Configure OTel in Ingress
-
Enable or Disable OTel on Ingress
By configuring whether to enable OTel on Ingress, you can better monitor and debug the request flow of applications. This helps trace the propagation path of requests between different services, identifying performance bottlenecks or errors.
Steps
Add the following configuration under the
metadata.annotationsfield of the Ingress:nginx.ingress.kubernetes.io/enable-opentelemetry: "true"Parameter Explanation:
- nginx.ingress.kubernetes.io/enable-opentelemetry: When set to
true, it indicates that the Ingress controller enables OpenTelemetry when processing requests through this Ingress, meaning the Trace information of the requests will be collected and reported. When set tofalseor this annotation is removed, it indicates that the Trace information of the requests will not be collected or reported.
- nginx.ingress.kubernetes.io/enable-opentelemetry: When set to
-
Enable or Disable OTel Trust on Ingress
The purpose of OTel Trust is to determine whether the Ingress trusts and uses the OTel Trace information (such as trace ID) in incoming requests.
Steps
Add the following configuration under the
metadata.annotationsfield of the Ingress:nginx.ingress.kubernetes.io/opentelemetry-trust-incoming-span: "true"Parameter Explanation:
- nginx.ingress.kubernetes.io/opentelemetry-trust-incoming-span: When set to
true, the Ingress will continue to use the existing Trace information, helping to maintain cross-service tracing consistency, allowing the entire request chain to be completely traced and analyzed in a distributed tracing system. When set tofalse, new tracing information will be generated for the request, which may cause the request to be treated as part of a new tracing chain upon entering the Ingress, interrupting cross-service tracing continuity.
- nginx.ingress.kubernetes.io/opentelemetry-trust-incoming-span: When set to
-
Add Different OTel Configurations on Ingress
This configuration allows you to customize the behavior and data export method of OTel for different Ingress resources, enabling fine-grained control for each service and helping to configure different tracing strategies or target services.
Steps
Add the following configuration under the
metadata.annotationsfield of the Ingress:apiVersion: networking.k8s.io/v1 kind: Ingress metadata: annotations: alb.ingress.cpaas.io/otel: > { "enable": true, "exporter": { "collector": { "address": "<jaeger-server>", # Replace <jaeger-server> with the server address for OTel data reporting, e.g., "address": "http://128.0.0.1:4318" "request_timeout": 1000 } } }Parameter Explanation:
- exporter: Specifies how to send the collected Trace data to the OTel Collector (OTel data reporting server).
- address: Specifies the address of the OTel Collector.
- request_timeout: Specifies the request timeout duration.
Use OTel in Applications
The following configuration shows the complete OTel configuration structure, which can be used to define how to enable and use OTel features in applications.
You can execute the following command on the cluster’s Master node using the CLI tool to obtain the complete configuration structure for OTel.
kubectl get crd alaudaloadbalancer2.crd.alauda.io -o json|jq ".spec.versions[2].schema.openAPIV3Schema.properties.spec.properties.config.properties.otel"Output result:
{
    "otel": {
        "enable": true
    }
    "exporter": {
        "collector": {
            "address": ""
          },
    },
    "flags": {
        "hide_upstream_attrs": false
        "notrust_incoming_span": false
        "report_http_request_header": false
        "report_http_response_header": false
    },
    "sampler": {
        "name": "",
        "options": {
            "fraction": ""
            "parent_name": ""
          },
      },
 }
Parameter Explanation:
| Parameter | Explanation |
|---|---|
| otel.enable | Whether to enable OTel features. |
| exporter.collector.address | The server address for OTel data reporting, supporting http/https protocols and domain names. |
| flags.hide_upstream_attrs | Whether to report information about upstream rules. |
| flags.notrust_incoming_span | Whether to trust and use the OTel Trace information (such as trace ID) in incoming requests. |
| flags.report_http_request_header | Whether to report the request header. |
| flags.report_http_response_header | Whether to report the response header. |
| sampler.name | The name of the sampling strategy, please refer to Sampling Strategy for details. |
| sampler.options.fraction | Sampling rate. |
| sampler.options.parent_name | The parent strategy of the parent_base sampling strategy. |
Inheritance
By default, if certain OTel parameters are configured on the ALB and not on the FT, the FT will use the ALB’s parameters as its own configuration, meaning the FT inherits the ALB’s configuration. Similarly, Rules can inherit configurations from both ALB and FT.
-
ALB: Configurations on the ALB are usually global and default settings. You can configure global parameters here, such as the Collector address, which will be inherited by the underlying FT and Rule.
-
FT: FT can inherit the configuration from ALB. If certain OTel parameters are not configured on the FT, it will use the ALB’s configuration. However, FT can also be further customized. For example, you can selectively enable or disable OTel on FT without affecting other FTs or the global settings of ALB.
-
Rule: Rules can inherit configurations from both ALB and FT. However, they can also be further customized. For instance, a specific Rule can choose not to trust incoming OTel Trace information or adjust the sampling strategy, etc.
Operational Steps
You can add relevant OTel configurations by configuring the spec.config.otel field in the YAML files of ALB, FT, and Rule.
Related Information
Sampling Strategy
| Parameter | Explanation |
|---|---|
| always on | Always report all trace data. |
| always off | Never report trace data. |
| traceid-ratio | Decides whether to report based on traceid. The format of traceparent is xx-traceid-xx-flag, where the first 16 characters of traceid represent a 32-bit hexadecimal integer. If this integer is less than fraction multiplied by 4294967295 (i.e., (2^32-1)), then it will be reported. |
| parent-base | Decides whether to report based on the flag part of the traceparent in the request. When the flag is 01, it reports, e.g., curl -v "http://$ALB_IP/" -H 'traceparent: 00-xx-xx-01'; when the flag is 02, it does not report, e.g., curl -v "http://$ALB_IP/" -H 'traceparent: 00-xx-xx-02'. |
Attributes
-
Resource Attributes
These attributes are reported by default.
Parameter Explanation hostname Hostname of the ALB Pod service.name Name of the ALB service.namespace Namespace where ALB resides service.type Default is ALB service.instance.id Name of the ALB Pod -
Span Attributes
-
Attributes reported by default
Parameter Explanation http.status_code Status code http.request.resend_count Retry count alb.rule.rule_name Name of the rule matched by this request alb.rule.source_type Type of the rule matched by this request, currently only Ingress alb.rule.source_name Name of the Ingress alb.rule.source_ns Namespace where Ingress resides -
Attributes reported by default but can be disabled by modifying the flag.hide_upstream_attrs field
Parameter Explanation alb.upstream.svc_name Name of the forwarded Service (internal routing) alb.upstream.svc_ns Namespace of the forwarded Service (internal routing) alb.upstream.peer IP address and port of the forwarded Pod -
Attributes not reported by default but can be enabled by modifying the flag.report_http_request_header field
Parameter Explanation http.request.header. Request Header -
Attributes not reported by default but can be enabled by modifying the flag.report_http_response_header field
Parameter Explanation http.response.header. Response Header
-
Configuration Example
In the YAML configuration below, an ALB is deployed using Jaeger as the OTel server and Hotrod-proxy as the demo backend. By configuring Ingress rules, when a client requests the ALB, the traffic will be forwarded to HotROD. Meanwhile, communication between microservices within HotROD is also forwarded through the ALB.
-
Save the following YAML to a file named
all.yaml.apiVersion: apps/v1 kind: Deployment metadata: name: hotrod spec: replicas: 1 selector: matchLabels: service.cpaas.io/name: hotrod service_name: hotrod template: metadata: labels: service.cpaas.io/name: hotrod service_name: hotrod spec: containers: - name: hotrod env: - name: PROXY_PORT value: "80" - name: PROXY_ADDR value: "otel-alb.default.svc.cluster.local:" - name: OTEL_EXPORTER_OTLP_ENDPOINT value: "http://jaeger.default.svc.cluster.local:4318" image: theseedoaa/hotrod-with-proxy:latest imagePullPolicy: IfNotPresent command: ["/bin/hotrod","all","-v"] --- apiVersion: networking.k8s.io/v1 kind: Ingress metadata: name: hotrod-frontend spec: ingressClassName: otel-alb rules: - http: paths: - backend: service: name: hotrod port: number: 8080 path: /dispatch pathType: ImplementationSpecific - backend: service: name: hotrod port: number: 8080 path: /frontend pathType: ImplementationSpecific --- apiVersion: networking.k8s.io/v1 kind: Ingress metadata: name: hotrod-customer spec: ingressClassName: otel-alb rules: - http: paths: - backend: service: name: hotrod port: number: 8081 path: /customer pathType: ImplementationSpecific --- apiVersion: networking.k8s.io/v1 kind: Ingress metadata: name: hotrod-route spec: ingressClassName: otel-alb rules: - http: paths: - backend: service: name: hotrod port: number: 8083 path: /route pathType: ImplementationSpecific --- apiVersion: v1 kind: Service metadata: name: hotrod spec: internalTrafficPolicy: Cluster ipFamilies: - IPv4 ipFamilyPolicy: SingleStack ports: - name: frontend port: 8080 protocol: TCP targetPort: 8080 - name: customer port: 8081 protocol: TCP targetPort: 8081 - name: router port: 8083 protocol: TCP targetPort: 8083 selector: service_name: hotrod sessionAffinity: None type: ClusterIP --- apiVersion: apps/v1 kind: Deployment metadata: name: jaeger spec: replicas: 1 selector: matchLabels: service.cpaas.io/name: jaeger service_name: jaeger template: metadata: labels: service.cpaas.io/name: jaeger service_name: jaeger spec: containers: - name: jaeger env: - name: LOG_LEVEL value: debug image: jaegertracing/all-in-one:1.58.1 imagePullPolicy: IfNotPresent hostNetwork: true tolerations: - operator: Exists --- apiVersion: v1 kind: Service metadata: name: jaeger spec: internalTrafficPolicy: Cluster ipFamilies: - IPv4 ipFamilyPolicy: SingleStack ports: - name: http port: 4318 protocol: TCP targetPort: 4318 selector: service_name: jaeger sessionAffinity: None type: ClusterIP --- apiVersion: crd.alauda.io/v2 kind: ALB2 metadata: name: otel-alb spec: config: loadbalancerName: otel-alb otel: enable: true exporter: collector: address: "http://jaeger.default.svc.cluster.local:4318" request_timeout: 1000 projects: - ALL_ALL replicas: 1 resources: alb: limits: cpu: 200m memory: 2Gi requests: cpu: 50m memory: 128Mi limits: cpu: "1" memory: 1Gi requests: cpu: 50m memory: 128Mi type: nginx -
Execute the following command in the CLI tool to deploy Jaeger, ALB, HotROD, and all CRs needed for testing.
kubectl apply -f ./all.yaml -
Execute the following command to get the access address for Jaeger.
export JAEGER_IP=$(kubectl get po -A -o wide | grep jaeger | awk '{print $7}'); echo "http://$JAEGER_IP:16686" -
Execute the following command to get the access address for otel-alb.
export ALB_IP=$(kubectl get po -A -o wide | grep otel-alb | awk '{print $7}'); echo $ALB_IP -
Execute the following command to send a request to HotROD through the ALB. The ALB will report the Trace to Jaeger.
curl -v "http://<$ALB_IP>:80/dispatch?customer=567&nonse=" # Replace the <$ALB_IP> part in the command with the otel-alb access address obtained in the previous step -
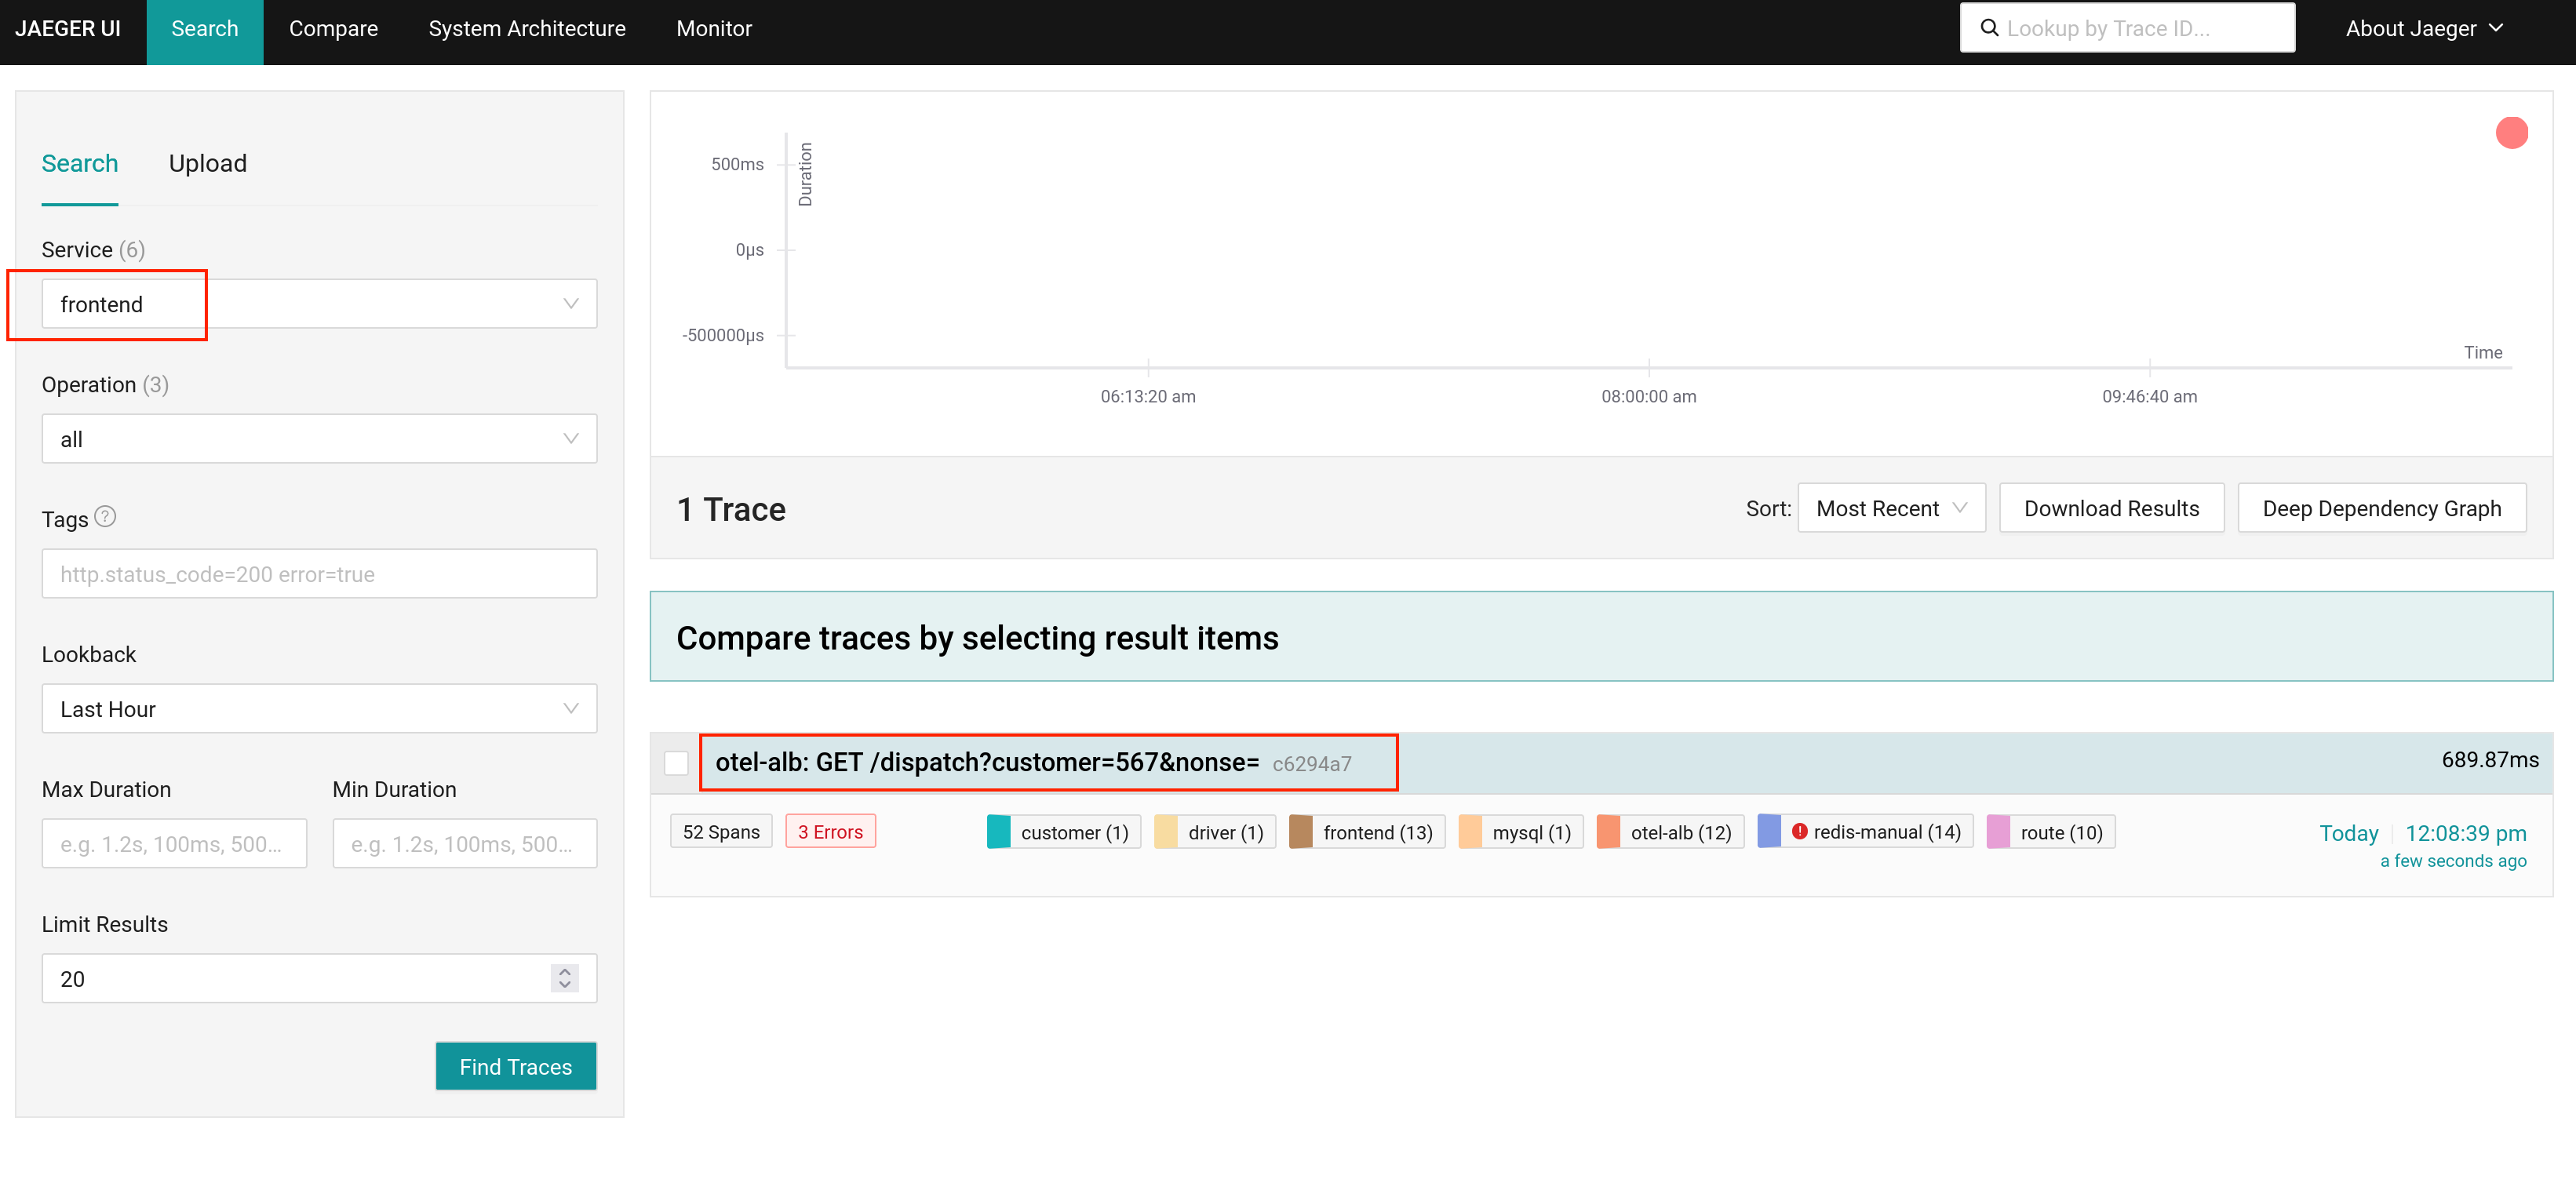
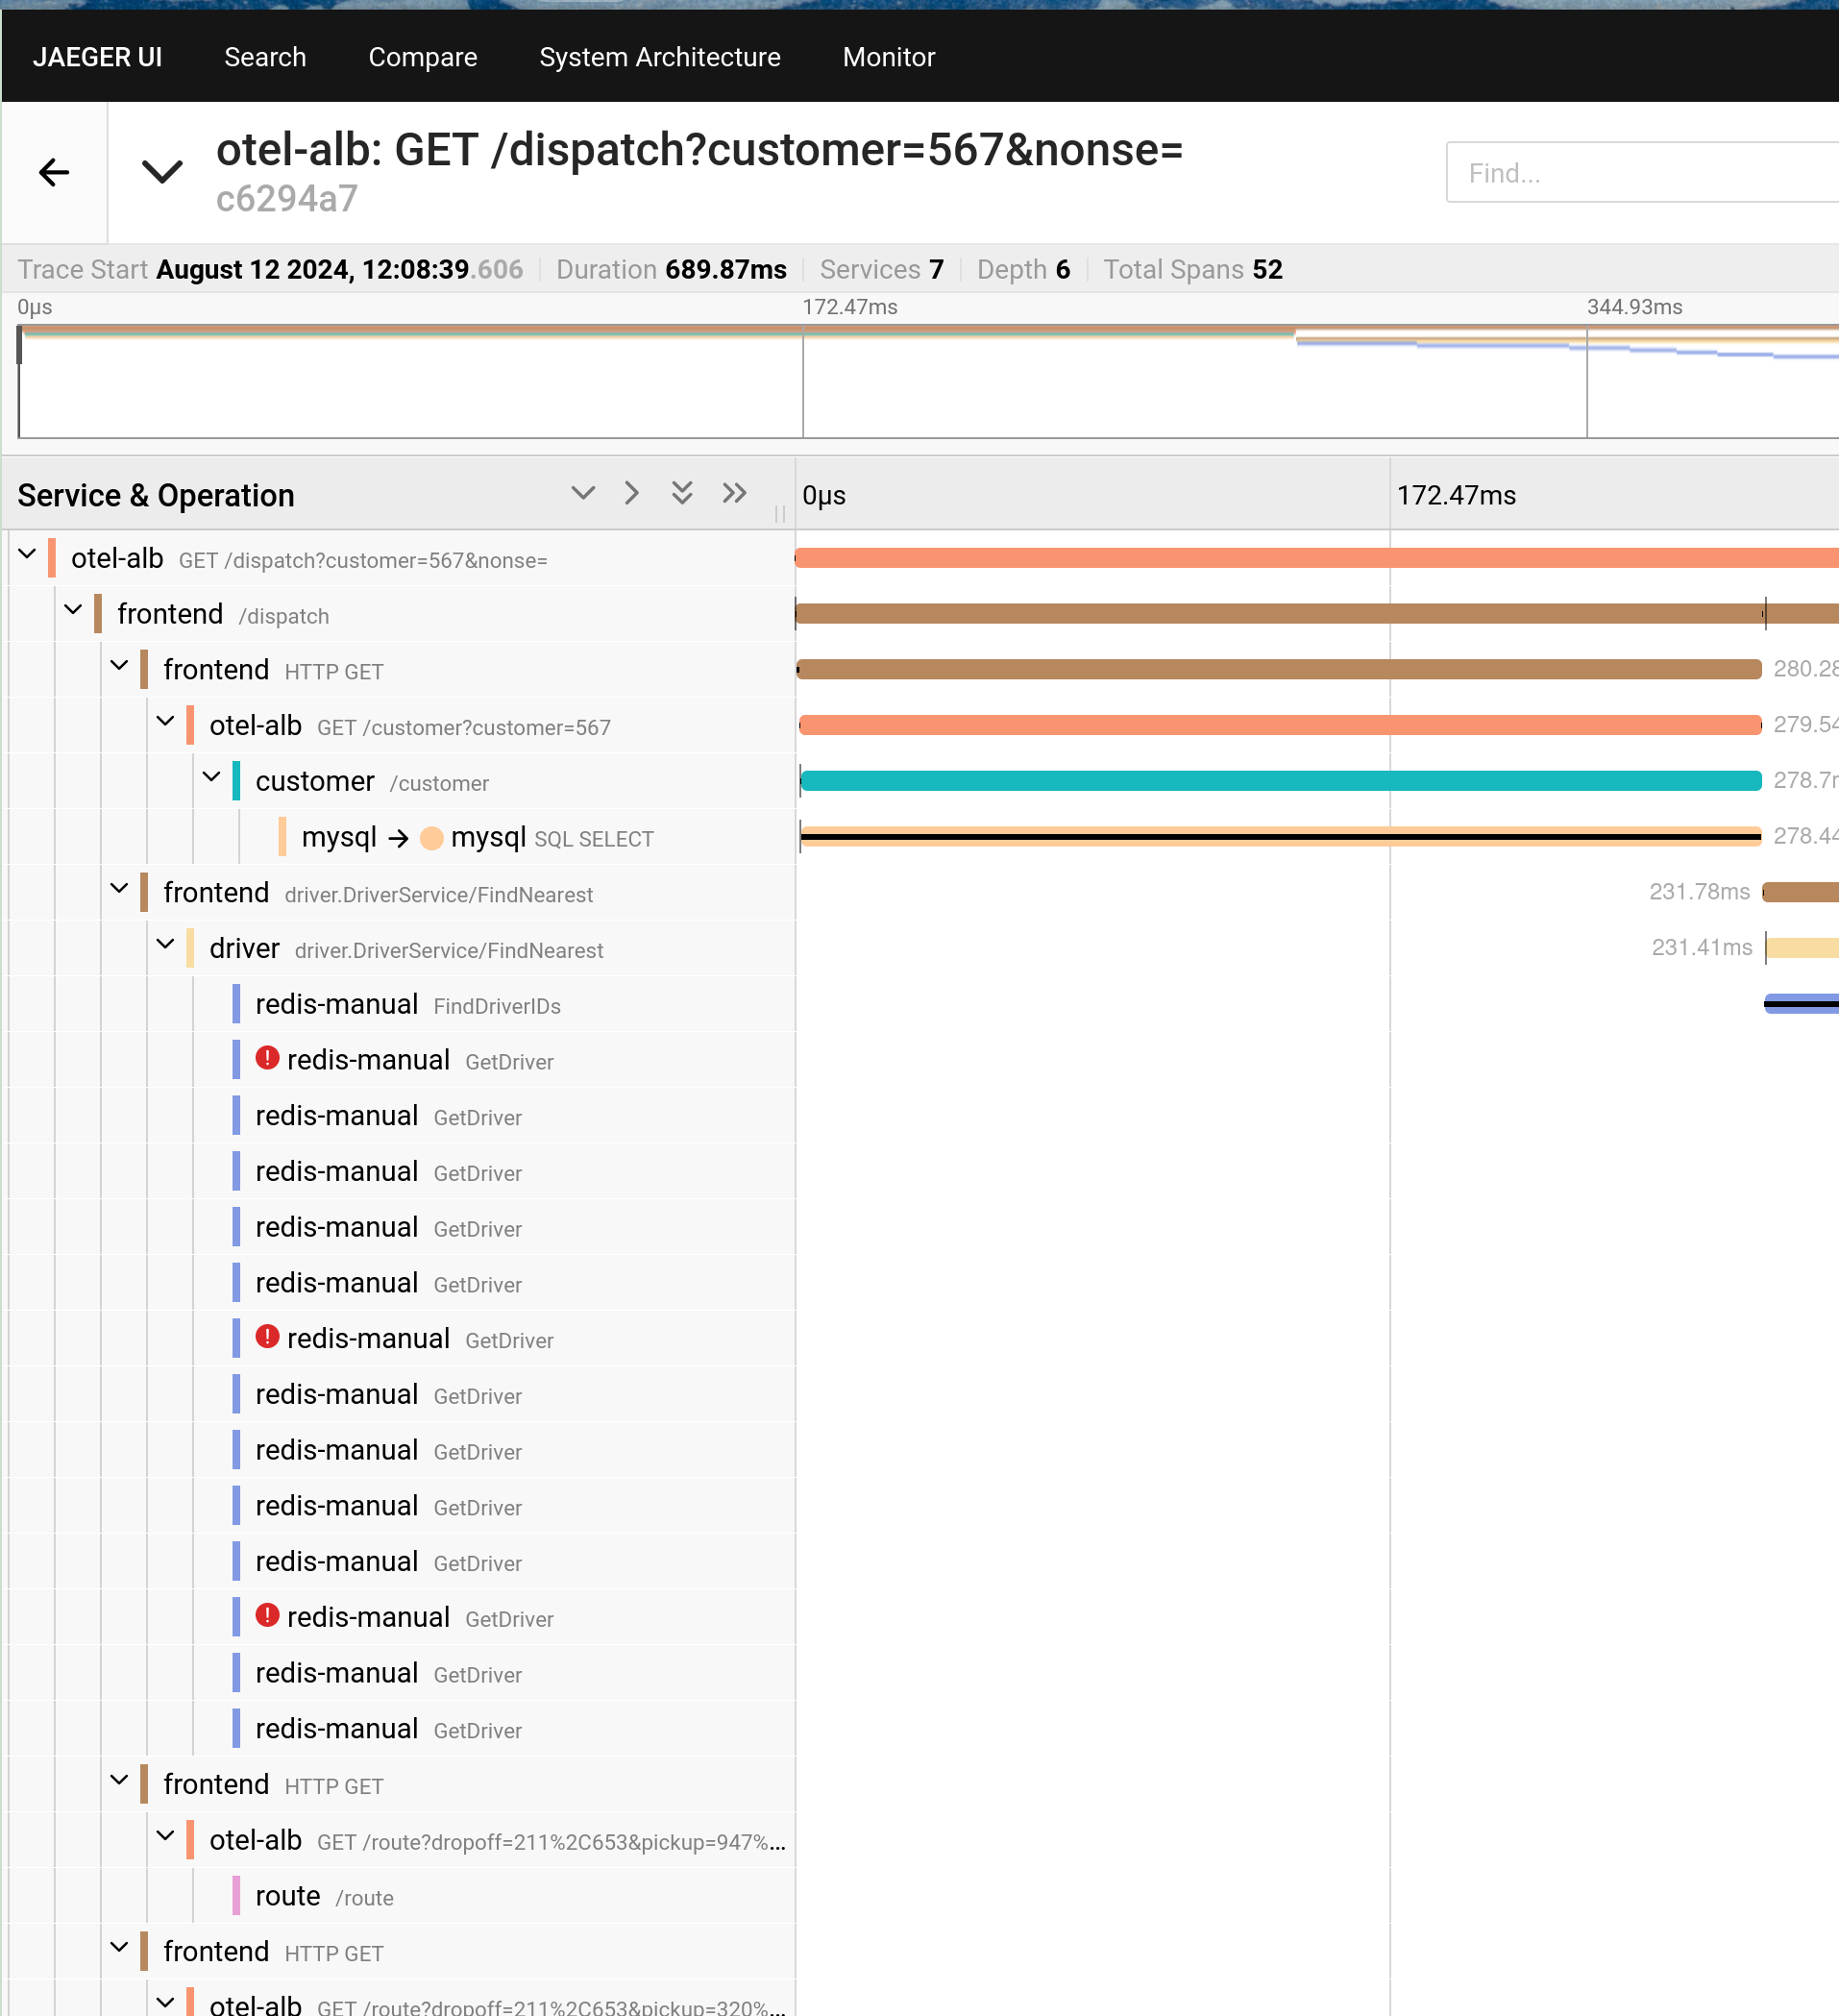
Open the Jaeger access address obtained in Step 3 to view the results.