Node Monitoring
View monitoring data of nodes on the node details page.
Tips:
-
When the number of nodes in a cluster is greater than 1, on the node details page, click on the current node name in the resource path area to expand the node dropdown list. Click to select a node for quick switching to the details page of other nodes as shown in the image below.

-
When monitoring components are configured in the cluster, node monitoring data can be viewed. You can check resource status, resource usage, and resource trend statistics on nodes.
Procedure of Operation
-
In the left navigation bar, click Clusters > Cluster of clusters.
-
Click on the cluster name where the node to be viewed is located.
-
Under the Nodes tab, click on the node name to be viewed.
-
Click on the Monitoring tab to access the page displaying monitoring data of the node, where you can view relevant monitoring data of the node.
Tips:
-
Hover over a card and click on
 icon to view the PromQL expression; click on
  icon to export PromQL expressions of all charts on the current page.
 -
When the number of nodes in a cluster is greater than 1, on the node details page, click on the current node name in the resource path area to expand the node dropdown list. Click to select a node for quick switching to the details page of other nodes as shown in the image below.
Note:
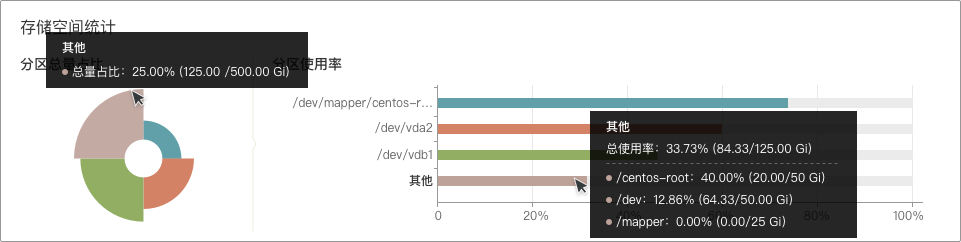
In the storage space statistics display area, when a node has more than 4 storage partitions:
-
In the partition total proportion chart, the top 3 partitions sorted by proportion will be displayed separately, while the remaining partitions will be shown as Other proportion area. Moving the cursor over the proportion area will display the total proportion data of the remaining partitions.
-
In the partition usage rate bar chart, the top 3 partitions sorted by usage rate will be displayed separately, while the remaining partitions will be shown as Other bar chart. Moving the cursor over the bar chart will display the total usage rate of the remaining partitions and their individual usage rates.
Refer to the table below for explanations of monitoring trend statistics.
Parameter Description CPU Within a specified time range, shows CPU usage rate, request rate, and limit rate.
Usage Rate = Sum of CPU usage values of all Pods on the node / Total CPU capacity of the node.
Note: In case of a sudden increase in CPU usage rate during a period, identify the process consuming the most CPU resources first. For example, for Java custom applications, memory leaks or infinite loops in the code can lead to a spike in CPU usage.
Request Rate = Sum of CPU request values of all Pods on the node / Total CPU capacity of the node.
Note: A sudden increase in CPU request rate may indicate unreasonable overselling settings in the cluster or high request values set for Pods running on the node, leading to resource wastage.
Limit Rate = Sum of CPU limit values of all Pods on the node / Total CPU capacity of the node.
Note: A sudden increase in CPU limit rate may indicate high limit values set for Pods running on the node, leading to wastage of CPU resources.Memory Within a specified time range, shows memory usage rate, request rate, and limit rate.
Usage Rate = Sum of memory usage values of all Pods on the node / Total memory capacity of the node.
Memory is a critical component on servers and acts as a bridge between CPU and communication. Hence, memory performance has a significant impact on machine operations. When programs run, tasks like data loading, thread concurrency, and I/O buffering rely on memory. The amount of available memory determines if a program can run smoothly and how it runs.
Request Rate = Sum of memory request values of all Pods on the node / Total memory capacity of the node.
Note: A sudden increase in memory request rate may indicate unreasonable overselling settings in the cluster or high request values set for Pods running on the node, leading to resource wastage.
Limit Rate = Sum of memory limit values of all Pods on the node / Total memory capacity of the node.
Note: A sudden increase in memory limit rate may indicate high limit values set for Pods running on the node, leading to wastage of memory resources.Storage Within a specified time range, shows space usage rate and inode usage rate.
Space Usage Rate = Storage space usage value / Total storage space value.
By monitoring historical disk space data, you can assess disk usage during a given period. In cases where disk usage is high, you can free up disk space by cleaning unnecessary images or containers.
Inode Usage Rate = Inode storage usage value / Total inode storage value.
Note: Each file must have an inode for storing file metadata such as file creator and creation date. Inodes also consume disk space, and many small cache files can easily deplete inode resources. Furthermore, when inodes are exhausted but disk space is not full, new files cannot be created on the disk.System Load Average CPU load within 1 minute, 5 minutes, and 15 minutes. It is a ratio of total number of processes being executed or waiting to be executed by CPU to maximum number of processes CPU can execute, serving as an important indicator reflecting system workload.
Note: If curves for 1 minute/5 minutes/15 minutes are similar over a certain period, it indicates relatively stable CPU load in the cluster.
If value for 1 minute at a specific time or period is significantly higher than that for 15 minutes, it indicates increasing load in recent 1 minute and further observation is required. Once value for 1 minute exceeds number of CPUs, it may indicate system overload. Root cause analysis is necessary.
If value for 1 minute at a specific time or period is much lower than that for 15 minutes, it indicates decreasing load within recent 1 minute after high load in previous 15 minutes.Disk Throughput The disk throughput within a specified time range refers to the speed of data transmission on the disk, which is the total of read and write data. Disk IOPS The disk IOPS within a specified time range is the sum of continuous reads and writes per second, representing the performance metric of the number of read and write operations per second on the disk. Network Traffic Rate The network traffic rate within a specified time range is the incoming and outgoing rate of network traffic statistically based on the physical network card of the node. Network Packet Rate (per second) The network packet rate within a specified time range is the receiving and sending rate of network packets statistically based on the physical network card of the node. -