Deploying Monitoring Components
When no monitoring components are deployed in the cluster, you can deploy the Prometheus, VictoriaMetrics, OCP Monitoring Registration Component in the cluster to provide capabilities such as monitoring data collection, storage, querying, display, and forwarding.
Pre-deployment considerations
-
The OCP Monitoring Registration Component is only applicable to OpenShift clusters that are connected to the platform; Other types of clusters can refer to How to Choose a Monitoring Component? to select the appropriate plugin.
-
After the monitoring component is successfully deployed, if a new upgradeable version appears later, you can upgrade it through the Upgrade Function Component .
Prometheus
Prerequisites
If you want to use Storage Class or Persistent Volume to store monitoring data, please create the corresponding storage resources for the cluster in advance under the Storage function.
Procedure
-
In the left navigation bar, click Cluster Management > Cluster.
-
Click on the cluster name of the monitoring component to be deployed.
-
On the Plugins tab, click the
 > Deploy button on the right side of the Prometheus plugin.
 -
Refer to the following instructions to configure the relevant parameters.
Parameter Description Scale Configuration The platform supports three scale configurations: Small scale, Medium scale, and Large scale. The default values for the three sizes of component parameters come from the recommended values after platform stress testing. You can choose to configure them according to your actual cluster size or customize quotas based on your actual business needs.
Note: The default values will be dynamically adjusted based on the actual stress test data of the platform. When the platform version is upgraded, the default values will be automatically updated. If you do not need to update the default values with the platform upgrade, it is recommended to customize the configuration.Storage Type - LocalVolume: i.e. local volume, monitoring data will be stored on the node specified in the cluster, supporting custom storage size.
Note: The storage size will be affected by factors such as the retention period of monitoring data, the sampling period of monitoring data (scrape_interval), the number of Pods, and business. Please adjust the storage size according to the actual situation. You can refer to the official documentation or adjust the storage size based on the experimental test results and the actual usage in the running environment.
- StorageClass: i.e. Storage Class , monitoring data will be stored in a persistent volume generated according to the definition of the storage class, please fill in the name of the created storage class.
- PV: i.e. Persistent Volume , monitoring data will be stored in the created persistent volume, and the platform will match the persistent volume through the key and value labels of the persistent volume.
Note: After the monitoring component is deployed, the storage configuration cannot be modified. If you still need to modify the storage type, please contact technical support.Replica Count The number of container groups for monitoring components deployed within the cluster. The recommended number varies slightly depending on the storage type. Please refer to the interface prompts for configuration.
Note: Prometheus only supports deploying single nodes. If you have high availability requirements, please choose VictoriaMetrics.Parameter Configuration The data parameters for monitoring components can be adjusted according to requirements based on the interface prompts. -
Click Deploy.
Note: After Prometheus is deployed successfully, you can directly access the corresponding components through the following address (
<>is a variable and needs to be modified to the actual value). For example:https://new.example.cn/clusters/global/prometheus.Component Name Access Address Thanos <Platform Access Address>/clusters/<cluster>/prometheusPrometheus <Platform Access Address>/clusters/<cluster>/prometheus-0Alertmanager <Platform Access Address>/clusters/<cluster>/alertmanager
VictoriaMetrics
Prerequisites
-
If you only deploy the VictoriaMetrics agent, make sure that VictoriaMetrics Center has been deployed on other clusters.
-
If you want to use storage classes or persistent volumes to store monitoring data, create the corresponding storage resources for the cluster in advance in the Storage function.
Operation Steps
-
In the left navigation bar, click Cluster Management > Cluster.
-
Click the Cluster Name where the monitoring components will be deployed.
-
On the Plugins tab, click the
> Deploy button on the right side of the VictoriaMetrics plugin. -
Configure the relevant parameters according to the following instructions.
Parameter Description Scale Configuration The platform supports three scale configurations: Small scale, Medium scale, and Large scale. The default values for the three sizes of component parameters come from the recommended values after platform stress testing. You can choose to configure them according to your actual cluster size or customize quotas based on your actual business needs.
Note: The default values will be dynamically adjusted based on the actual stress test data of the platform. When the platform version is upgraded, the default values will be automatically updated. If you do not need to update the default values with the platform upgrade, it is recommended to customize the configuration.Deploy Only VictoriaMetrics Agent Whether to deploy only the log collection component VMAgent, which is responsible for collecting monitoring data on the current cluster.
Turning off the switch will deploy the full set of VictoriaMetrics components on the current cluster, including VMAgent, VMStorage (storage of monitoring data), VMAlert (evaluation of alarm rules, transmission of alarm messages), etc.
Turning on the switch, the current cluster needs to rely on VictoriaMetrics Center in the platform to provide complete monitoring capabilities.VictoriaMetrics Center A cluster on the platform that deploys the full set of VictoriaMetrics components, which can provide long-term storage, monitoring, and alarm capabilities for clusters that only deploy VictoriaMetrics agents on the platform. Storage Type - LocalVolume: The monitoring data will be stored on the node specified in the cluster, and the storage size can be customized.
Note: The storage size is affected by factors such as the retention period of monitoring data, the scrape interval of monitoring data, the number of pods, and business considerations. Please adjust the storage size according to the actual situation. You can refer to the official documentation or adjust the storage size based on the experimental test results and the actual usage in the running environment.
- StorageClass: The monitoring data will be stored in a persistent volume generated based on the definition of the storage class. Please fill in the name of the created storage class.
- PV: The monitoring data will be stored in the created persistent volume. The platform will match the persistent volume based on the key and value labels of the persistent volume.Replicas The number of replicas is the number of monitoring component container groups deployed in the cluster. The recommended number varies slightly depending on the storage type. Please refer to the interface prompts for configuration.
Note: When the storage type is LocalVolume, multiple replicas cannot be configured.Parameter configuration Parameter configuration is the data parameter of the monitoring component, which can be adjusted according to the requirements and reference interface prompts.
Tip: In the Retention time parameter, depending on VictoriaMetrics’ expiration deletion mechanism, it may temporarily retain data beyond its retention period, which will result in some data redundancy -
Click Deploy.
OCP Monitoring Registration Component
Prerequisites
OCP Monitoring Registration Component: The monitoring component has been deployed and is running normally in the OpenShift cluster that is connected to the platform.
Procedure
-
In the left navigation bar, click Cluster Management > Cluster.
-
Click the Cluster Name where the plugin will be deployed.
-
On the Plugins tab, click the
> Deploy button on the right side of OCP Monitoring Registration Component.
How to back up Prometheus monitoring data?
Prometheus monitoring data is stored in TSDB format and is stored in the specified path of the Prometheus container. The path is specified by the storage.tsdb.path configuration of the Prometheus container and is set to /prometheus by default. This directory is referred to as the storage.tsdb.path directory in the following text.
The storage is not real-time and some data is cached.
template:
    spec:
      containers:
        - args:
- '--storage.tsdb.path=/prometheus' # Prometheus Directory for storing monitoring data in containersNote: The Prometheus computing component is named prometheus-kube-prometheus-0 and is of type StatefulSet.
Example of TSDB formatted data is shown below:
├── 01FXP317QBANGAX1XQAXCJK9DB
│   ├── chunks
│   │   └── 000001
│   ├── index
│   ├── meta.json
│   └── tombstones
├── chunks_head
│   ├── 000022
│   └── 000023
├── queries.active
└── wal
    ├── 00000020
    ├── 00000021
    ├── 00000022
    ├── 00000023
    └── checkpoint.00000019
        └── 00000000
Notes
When storing monitoring data, Prometheus first puts the collected data into a cache and then periodically writes the data in the cache to the storage directory. The following backup methods all use the storage directory as the data source for backup, so the backup data does not include the data stored in the cache during backup.
Method 1 - Backup the Storage Directory
There are two ways to back up Prometheus monitoring data:
-
(Recommended) Log in to any control node of the cluster (or open the Kubectl tool of the cluster) and execute the following command line to copy the monitoring data from the storage.tsdb.path directory of the Prometheus container to the current directory.
# Target storage path is a custom storage path under the user's path when the command is executed on the command line,For example:prometheus-backup/ kubectl cp -n cpaas-system prometheus-kube-prometheus-0-0:/prometheus -c prometheus <Target storage path> -
Copy monitoring data from storage backend: Please choose the appropriate method based on the storage type selected during plugin deployment.
-
LocalVolume: Copy monitoring data from the
/cpaas/monitoring/prometheusdirectory on the node where the monitoring plugin is deployed. -
PV: Before uninstalling the plugin, you can directly copy the monitoring data from the storage.tsdb.path directory; after uninstalling the plugin, the PV is released and needs to be remounted to use the PV to copy the monitoring data from the mount directory of the PV.
Note: It is recommended to set the persistentVolumeReclaimPolicy attribute of the PV to
Retainto prevent data from being cleared after the PV is released. -
StorageClass: Before uninstalling the plugin, you can directly copy the monitoring data from the storage.tsdb.path directory; after uninstalling the plugin, the PV is released and needs to be remounted to use the PV to copy the monitoring data from the mount directory of the PV.
Note: It is recommended to set the reclaimPolicy attribute of the StorageClass to
Retainto prevent data from being cleared after the dynamically created PV is released.
-
Method 2 - Snapshot Backup
Steps
-
Log in to any control node of the cluster (or open the Kubectl tool of the cluster).
-
Execute the following command to update the kube-prometheus-0 resource. Add the
enableAdminAPI=trueconfiguration under the spec path to enable Prometheus’s Admin API.kubectl edit -n cpaas-system prometheus kube-prometheus-0Add the
enableAdminAPI=trueconfiguration and save it under the spec path.spec: enableAdminAPI: trueNote: After updating and saving the configuration, the Prometheus Pod (Pod name: prometheus-kube-prometheus-0-0) will restart. Wait for all Pods to be in the Running state before proceeding.
-
You can check the status of the Prometheus Pod with the following command line:
kubectl get pods -n cpaas-system prometheus-kube-prometheus-0-0 -owide -
Execute the following command line to call the API (
POST /api/v1/admin/tsdb/snapshot) and create a snapshot.curl -XPOST <Prometheus Pod IP>:9090/api/v1/admin/tsdb/snapshotexample:
# Call to create a snapshot API Command curl -XPOST 10.5.0.55:9090/api/v1/admin/tsdb/snapshot # Information returned after successful snapshot creation,name As the snapshot name {"status":"success","data":{"name":"20220428T094253Z-159a8b76700b57cc"}Note: Snapshots are stored in the specified path (
<storage.tsdb.path directory>/snapshots/) within the Prometheus container. Use the following command to copy the snapshot to the current directory:kubectl cp -n cpaas-system prometheus-kube-prometheus-0-0:<storage.tsdb.path Directory>/snapshots/<Snapshot name> -c prometheus ./<Target storage path> # Command example kubectl cp -n cpaas-system prometheus-kube-prometheus-0-0:/prometheus/snapshots/20220428T094253Z-159a8b76700b57cc -c prometheus ./prometheus-snapshots/
Loading Backup Data
Store the backup file (including snapshots) in the storage.tsdb.path directory of the Prometheus container, and Prometheus will automatically load the backup data.
Command line example:
# Copy backup data or snapshots to the container's "/prometheus" Directorybelow,The Directory where the backup data or snapshot is located in the example is "/prometheus-backup"
kubectl cp ./prometheus-backup cpaas-system/prometheus-kube-prometheus-0-0:/prometheus/
# Enter Prometheus Container
kubectl  exec -it -n cpaas-system prometheus-kube-prometheus-0-0 -c prometheus sh
# Move the backup data inside the container to the directory specified by storage.tsdb.path, which is the directory "/prometheus" below.
mv /prometheus/prometheus-backup/* /prometheus/ Shortcut: When the storage type of the plugin deployment is LocalVolume, simply copy the backup data to the /cpaas/monitoring/prometheus/prometheus-db/ directory on the node where the plugin is deployed.
How to backup monitoring data in VictoriaMetrics?
The monitoring data in VictoriaMetrics is stored in the specified path of the VictoriaMetrics container, which is specified by the -storageDataPath configuration of the VictoriaMetrics container and defaults to /vm-data. Hereinafter, it is referred to as the -storageDataPath directory.
The configuration of the -storageDataPath directory is as follows:
spec:
  template:
    spec:
      containers:
        - args:
- '-storageDataPath=/vm-data'Note: The VictoriaMetrics calculation component is named vmstorage-cluster and is of type StatefulSet.
Backup
Refer to vmbackup for backing up VictoriaMetrics monitoring data.
Loading Backup Data
Refer to vmrestore for loading backup data for VictoriaMetrics.
How to Choose a Monitoring Component?
When deploying monitoring components in a cluster, the platform supports two types of monitoring components: VictoriaMetrics and Prometheus. This chapter will show you the relevant information about monitoring components to help you choose a monitoring component.
Notes
At present, when deploying monitoring components in the cluster, only one of VictoriaMetrics and Prometheus is supported. When deploying VictoriaMetrics separately, VMAgent will be used to collect monitoring metrics.
-
For high availability and multi cluster monitoring needs, it is recommended to choose VictoriaMetrics as the monitoring component. Starting from version 3.18, VictorMetrics has been upgraded to Beta, so you can use it with confidence.
-
Without high availability requirements and with a small cluster size, it is recommended to choose Prometheus as the monitoring component.
Glossary
| Term | Definition |
|---|---|
| Prometheus Server | The Prometheus Server is the core component of the Prometheus component, responsible for obtaining, storing, and querying monitoring data. |
| Exporters | Exporters expose the endpoints where monitoring data is collected through HTTP services, allowing monitoring components to obtain the required monitoring data. |
| AlertManager | Alert processing center that supports creating alert rules based on PromQL. |
| PushGateway | Since Prometheus data collection is designed based on the Pull model, it is necessary to configure the network environment to allow Prometheus Server to communicate directly with Exporters. When this network requirement cannot be directly met, PushGateway can be used for intermediate transfer. Monitoring data from the internal network can be actively pushed to the Gateway through PushGateway. Prometheus Server can then obtain monitoring data from PushGateway in the same Pull manner. |
| VMStorage | The component responsible for monitoring data storage in VictoriaMetrics. |
| VMInsert | VMInsert can receive data from monitoring services through the remote write API and distribute it to available VMStorage nodes. |
| VMSelect | The monitoring query component. |
| VMAlert | Responsible for evaluating alert rules and passing corresponding alert messages to AlertManager. |
| VMAgent | Responsible for collecting monitoring metrics. |
| Apollo | A platform component used to support the query and export of operational statistics and log data. |
Component Introduction
-
Prometheus
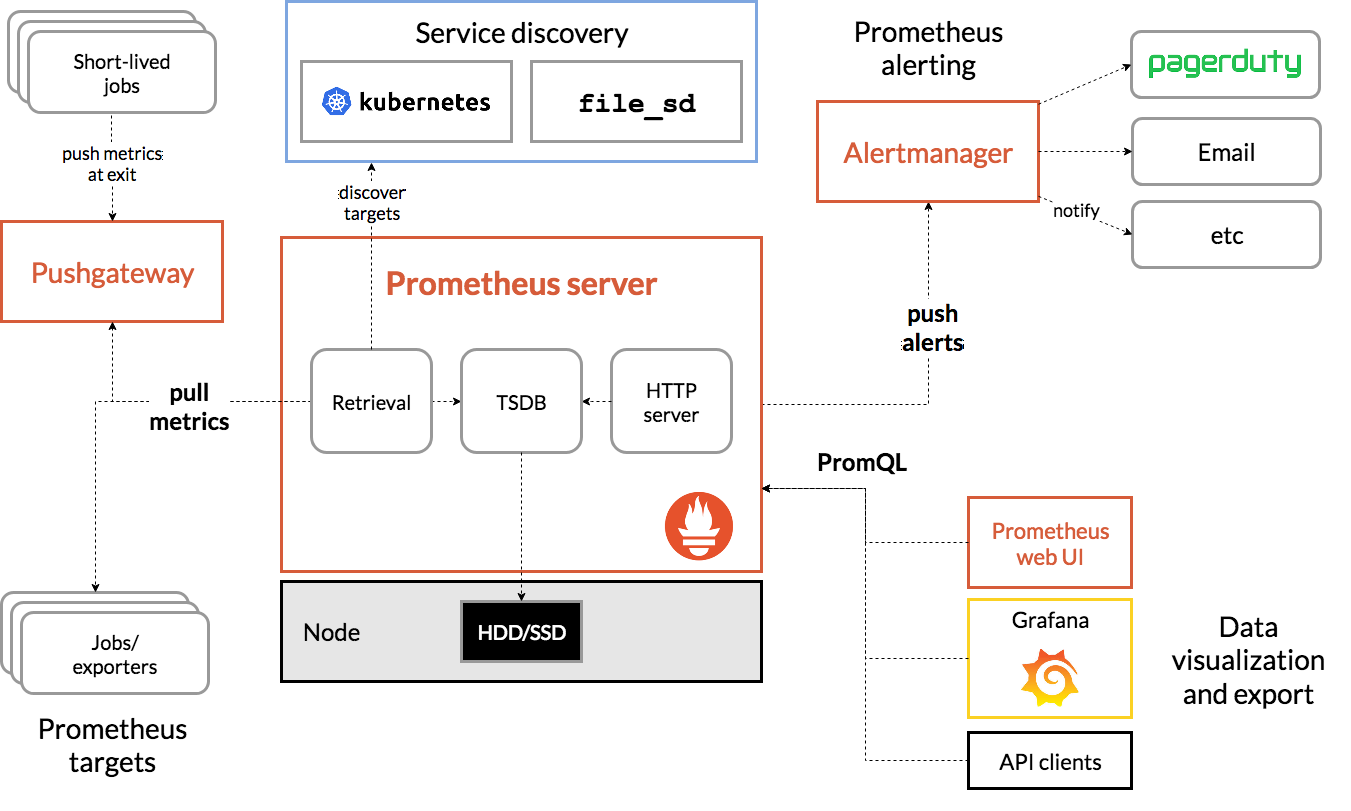
Prometheus is an open-source system monitoring and alerting system that has now joined the CNCF Foundation, becoming the second project hosted by CNCF after Kubernetes. In the Kubernetes container orchestration system, Prometheus is usually used for monitoring and also supports multiple Exporters for data collection. It supports PushGateway for data reporting and its performance is sufficient to support clusters with tens of thousands of nodes. The architecture diagram is as follows:
-
VictoriaMetrics
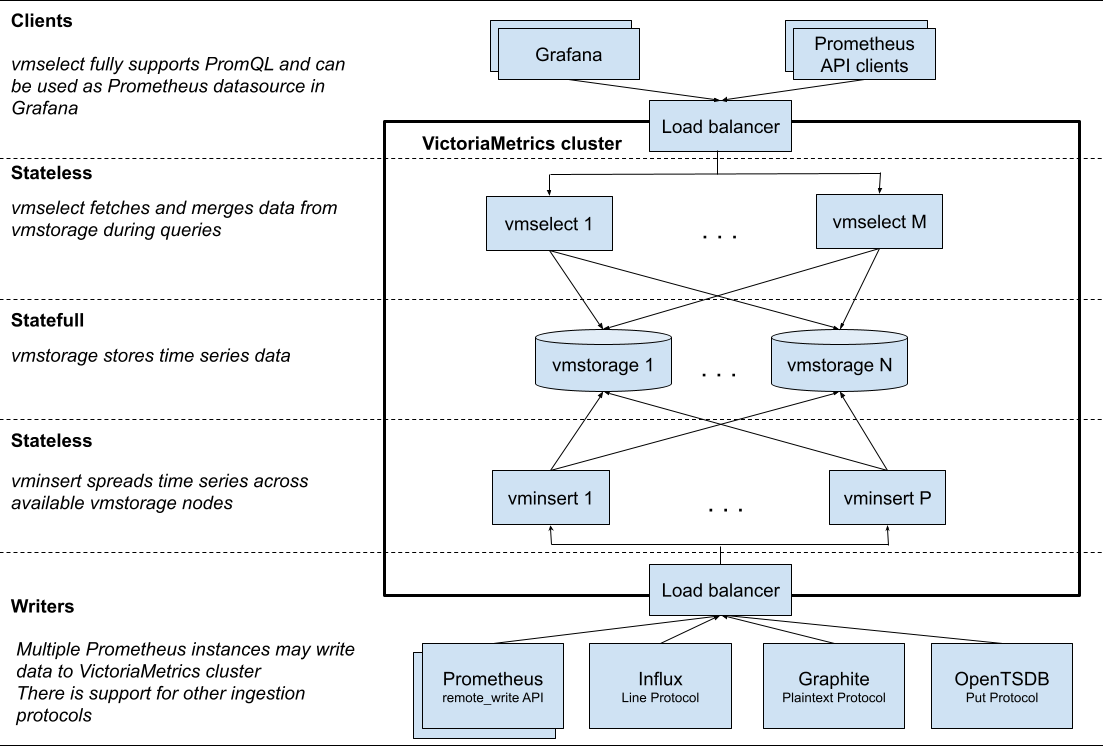
VictoriaMetrics is a fast, low-resource-consumption, and scalable monitoring solution and time-series database. It is commonly used for long-term storage of data from other monitoring systems such as Prometheus, InfluxDB, Graphite, and OpenTSDB. The clustered version of VictoriaMetrics can achieve high availability for large-scale Prometheus clusters and provides global views and reliable historical data storage. Its functionality is similar to Thanos, but its architecture is simpler and easier to use. The architecture diagram is shown below:
Competitive Comparison
Below are some of the features of two monitoring components as examples. For more information, please refer to the official documentation of each monitoring component:
| Prometheus | VictoriaMetrics | Description | |
|---|---|---|---|
| High Availability Deployment | Not supported | Supported | Prometheus cannot guarantee data consistency when collecting multiple sets of monitoring data for alerts and queries. VictoriaMetrics supports high availability deployment across multiple clusters and can ensure data consistency for alerts and queries. |
| Single Node Deployment | Supported | Supported | |
| Long-term Storage of Monitoring Data | Not suitable | Suitable | Prometheus recommends using remote storage for long-term monitoring data storage, while VictoriaMetrics can use local storage to save long-term monitoring data. |
| Local Storage | Supported | Supported | Prometheus does not support NFS type local storage and is not suitable for long-term storage of data. |
| Remote Storage | Supported | Supported | VictoriaMetric supports fewer remote storage components than Prometheus. |
| Data compression ratio | Low | High | One of the main advantages of VictoriaMetrics over Prometheus is its data compression capability. It uses more effective data compression algorithms; VictoriaMetrics claims to provide 10 times higher data compression than Prometheus, which is a key advantage for long-term data retention and cost optimization. |
| Resource Consumption | High | Low | VictoriaMetrics’ design is more resource efficient than Prometheus. Being able to obtain data more effectively, with less CPU usage, RAM, and disk space for the same amount of data. |
| Community Recognition | High | Medium | Prometheus has a very active and large community, providing extensive support and a rich plugin ecosystem, while VictoriaMetrics has a growing community that offers ongoing support and development |
Deployment Methods
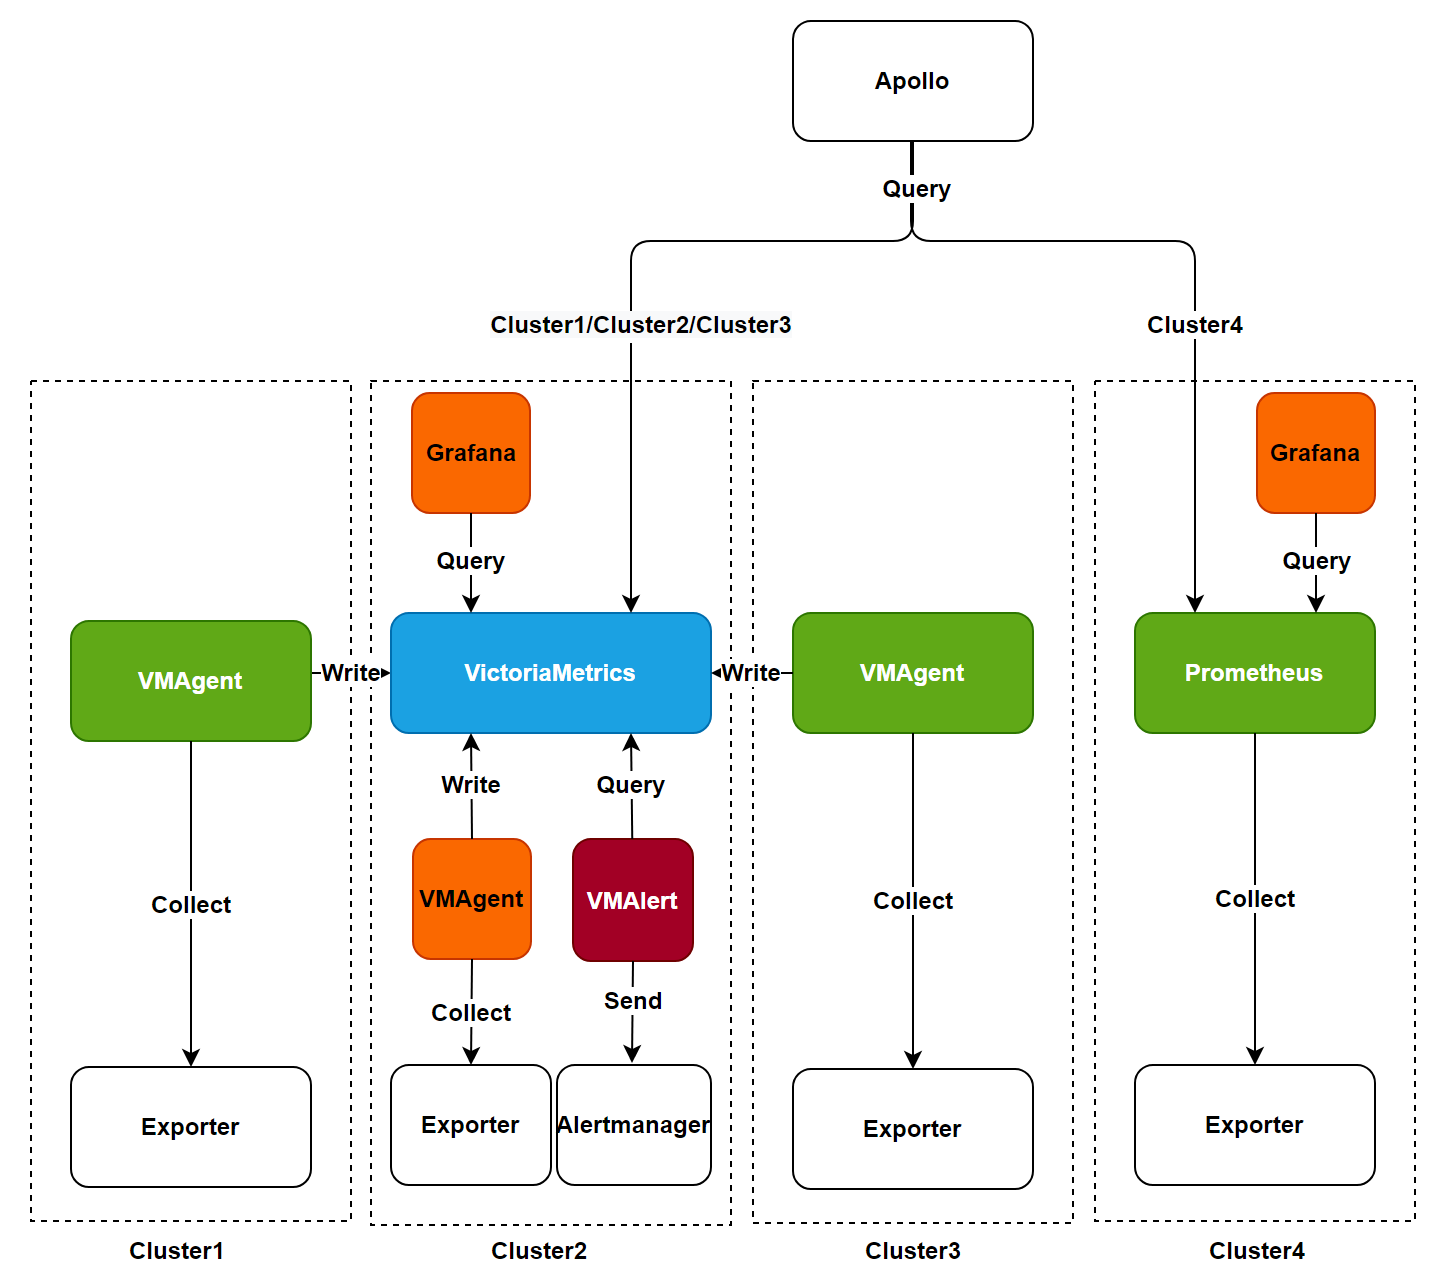
The following is a flowchart of the platform monitoring function, which can help you sort out the monitoring component architecture and choose the appropriate deployment method. When monitoring is not used on a large scale in the platform, you can choose the Prometheus deployment method. As the VictoriaMetrics monitoring function is still in the alpha stage, we recommend that you use the Prometheus deployment method.
You need to choose one of the following two monitoring deployment methods:
Note: When replacing monitoring components, please ensure that the other monitoring component has been uninstalled and that the current monitoring data will not be migrated to the new monitoring component.
-
Prometheus Deployment Method: This method is the case of cluster4 in the above figure. Use the Prometheus component to process the data collected from the Expoter, and query and display the monitoring data through the Dashbord.
-
VictoriaMetrics Deployment Method: There are two deployment modes for this method, using a single cluster or using a multi-cluster architecture.
-
Single Cluster Deployment Mode: This is the case of cluster2 in the above figure. All VictoriaMetrics-related components are deployed in one cluster, and VMAgent is used to process the data collected from the Expoter and write it to VictoriaMetrics. Use VMAlert to query monitoring data and send alert messages to Alertmanager. Use the Dashbord to query and display monitoring data.
Note: It is recommended by the official that the single cluster deployment mode is preferred for scales below 1 million data per second, otherwise the multi-cluster mode can be used for deployment.
-
Multi-cluster deployment mode: For the situation of cluster1/cluster2/cluster3 in the above figure, deploy VictoriaMetrics proxy (i.e. VMAgent) in the business cluster, and use VMAgent in the business cluster to process the data collected from Exporter and write it into VictoriaMetrics in the monitoring cluster.
Note: When deploying VictoriaMetrics proxy in the platform, make sure that VictoriaMetrics service has been deployed in a single-cluster manner in other clusters.
-
Choose Suggestions
-
Consider using VictoriaMetrics for scenarios
-
High performance and scalability requirements:If your monitoring system needs to handle high-throughput data and long-term storage, VictoriaMetrics provides high-performance monitoring solutions, especially for large-scale deployments.
-
Cost effectiveness:Scenarios that require reducing storage and computing resource costs. VictoriaMetrics is renowned for its efficient data compression algorithms and low resource consumption, which help reduce infrastructure costs.
-
High availability requirements:For scenarios that require high availability of components, VictoriaMetrics supports high availability deployment and can be used as an option.
-
Data compression and storage optimization:We need to optimize the use of storage space, especially in cloud environments where we want to reduce storage costs.
-
-
Consider scenarios using Prometheus
-
Existing Prometheus users:If you are already using Prometheus and have not encountered performance bottlenecks or specific storage requirements, it may be more appropriate to continue using Prometheus as it has a mature community and extensive integration support.
-
Simple monitoring requirements:For small or medium-sized projects that do not require high availability, Prometheus is sufficient and its open source features allow for free customization and extension.
-
Be cautious about the adoption of new tools:If one is cautious about adopting new technologies or if existing monitoring solutions already meet business needs, there is no need to migrate to VictoriaMetrics.
-
Specific ecosystem integration:If the monitoring ecosystem is deeply integrated with Prometheus and the migration cost is high, then continuing to use Prometheus may be more reasonable.
-