Summary
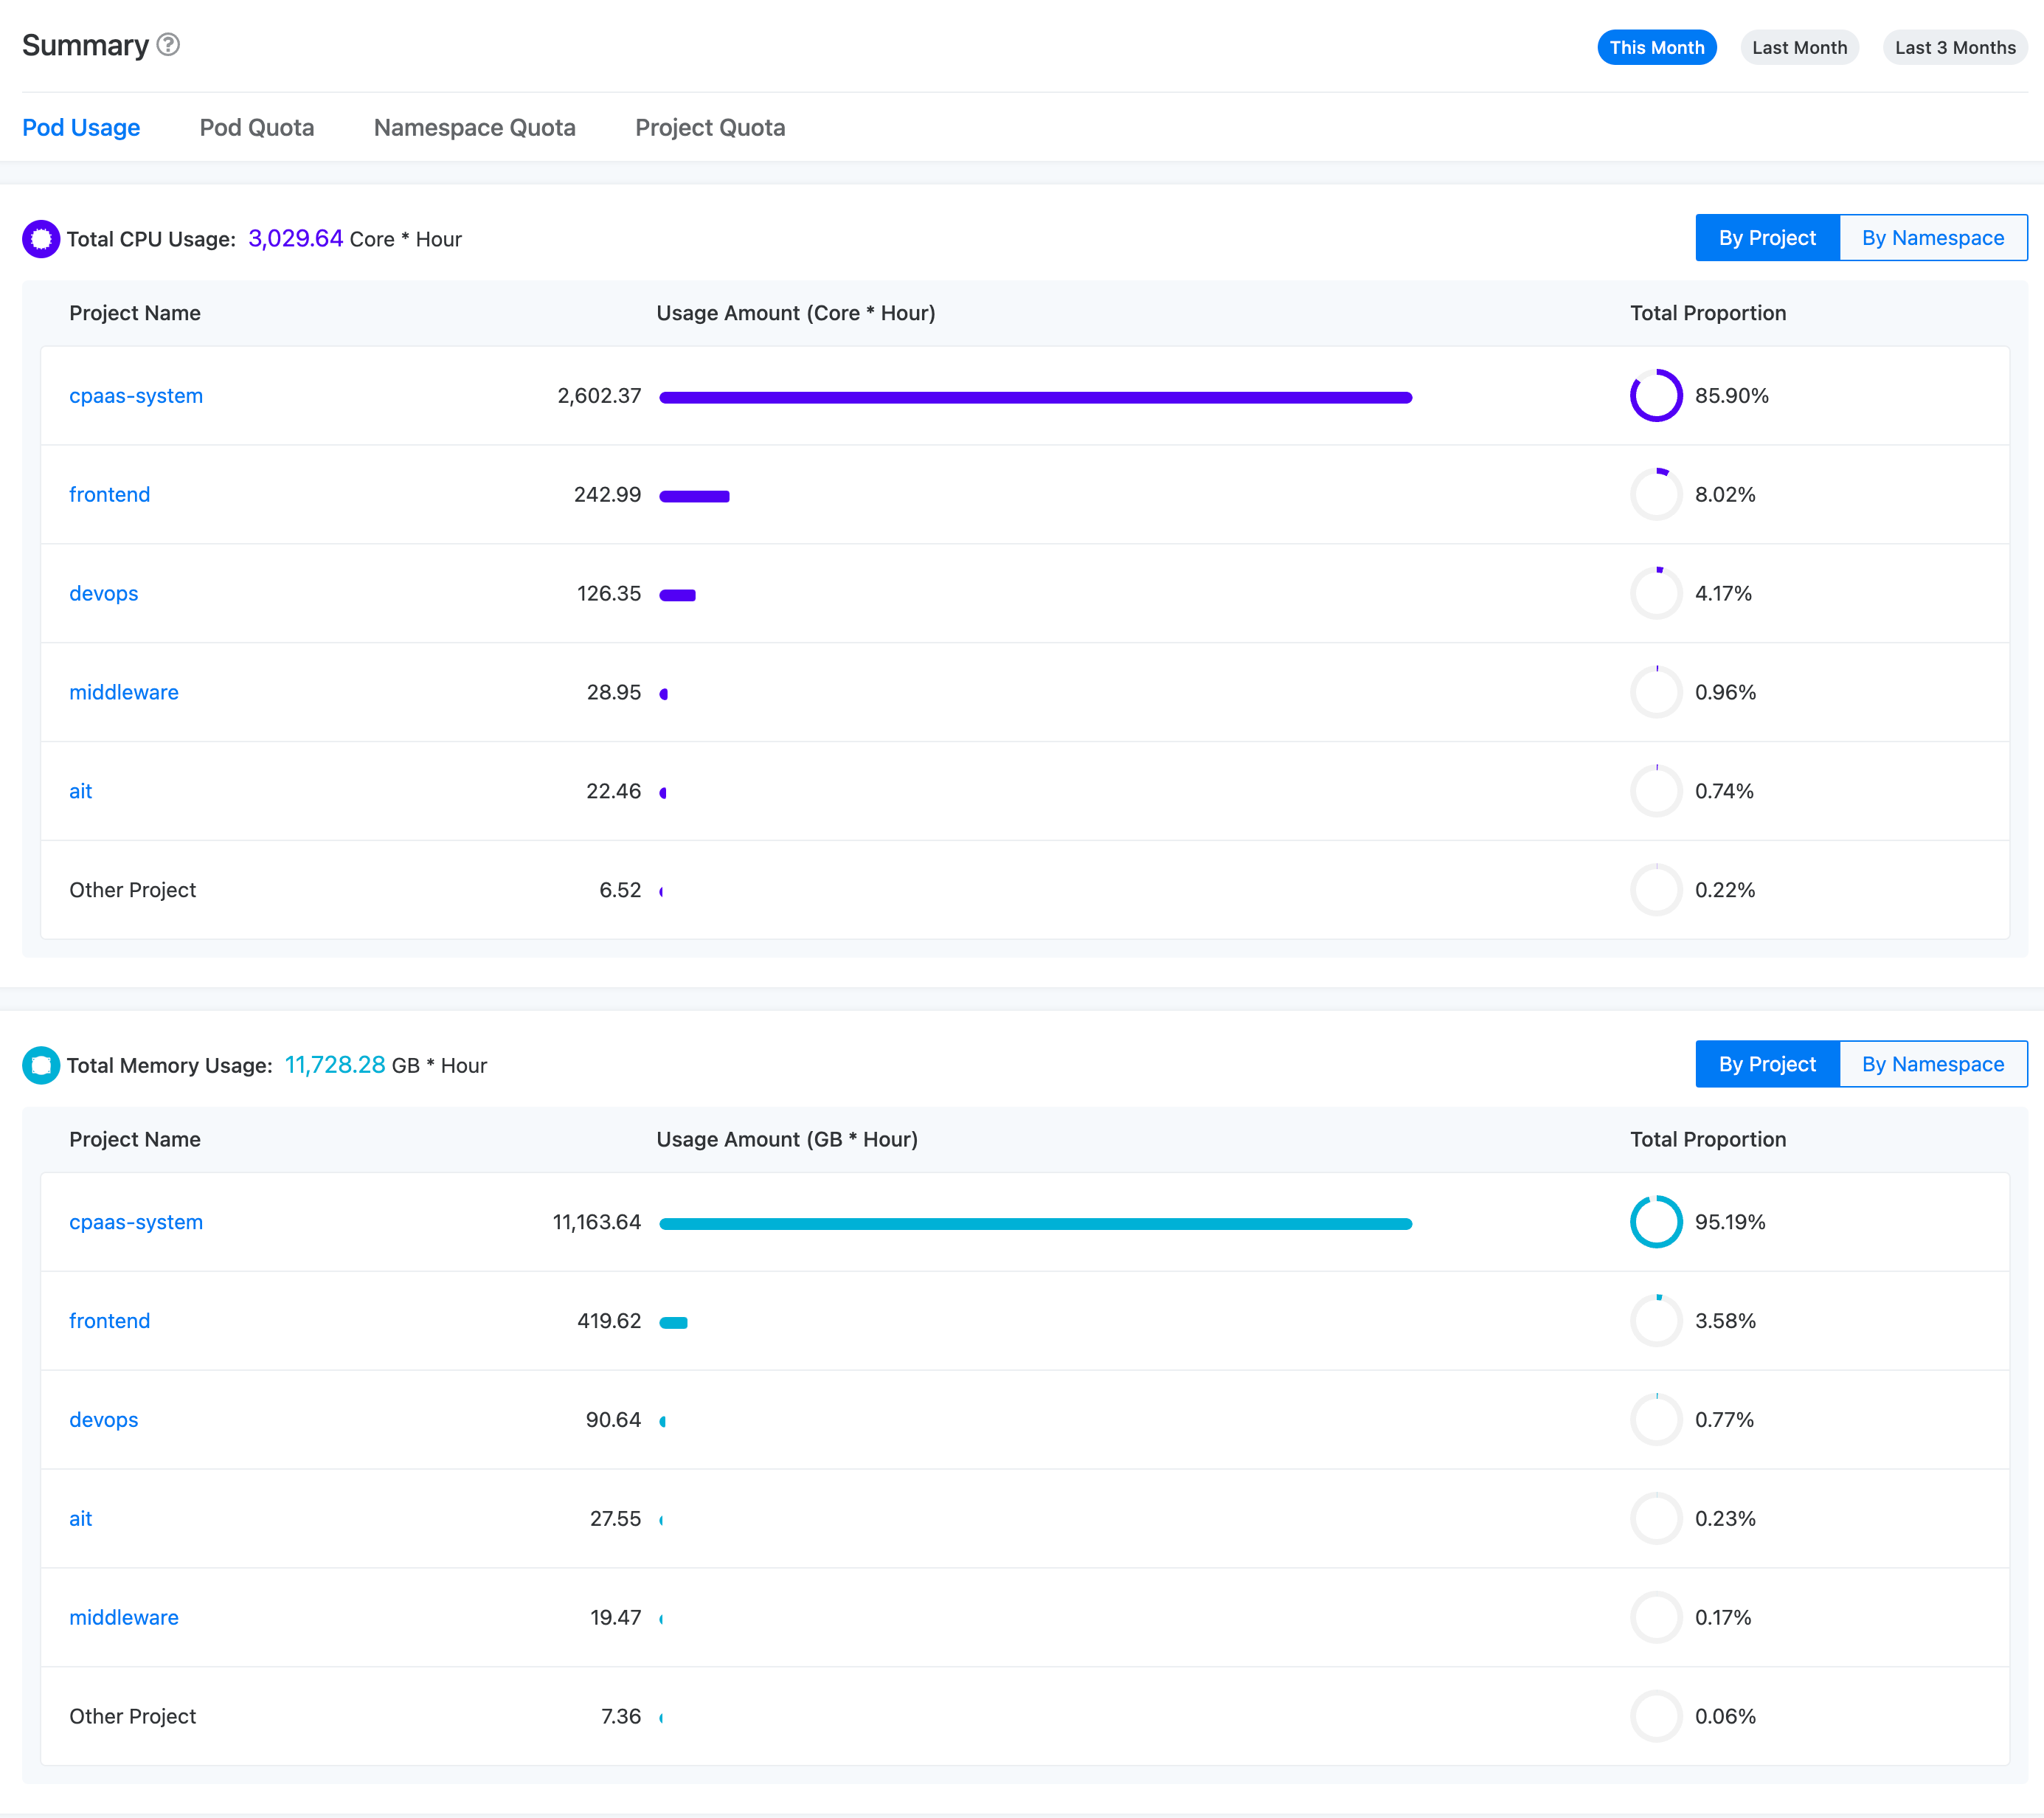
The operational overview of the platform displays the total usage of CPU/memory and usage statistics of the top 5 projects or namespaces in terms of usage, within the specified time range, through visual reports. You can view the usage statistics of container groups, container group quotas, namespace quotas, and total CPU/memory usage by project or namespace for the current month (default), last month, or the last 3 months (the current month and the previous two whole months).
Procedure
-
Click Operation Statistics > Operational Overview on the left navigation bar.
You can switch the time range, statistics items, and granularity to view the corresponding operational overview data, as shown in the figure below.
Note: The usage of container groups is calculated based on the actual usage of Pods, and the quota of container groups is calculated based on the request size of Pods.