Overview
In the Platform Management page, administrators can manage deployed products, clusters, Kubernetes resources, platform users, roles, IDPs (Identity Providers), licenses, and view operational statistics and audit data for the platform.
In the Overview feature page, you are provided with a summarized interface for visualizing platform resource monitoring data. This helps users quickly and comprehensively understand the overall resource scale and status of resources on the platform. It highlights resource data trends and abnormal information, enabling users to promptly identify and locate issues, significantly improving the efficiency of diagnosing online problems.
Interface Overview
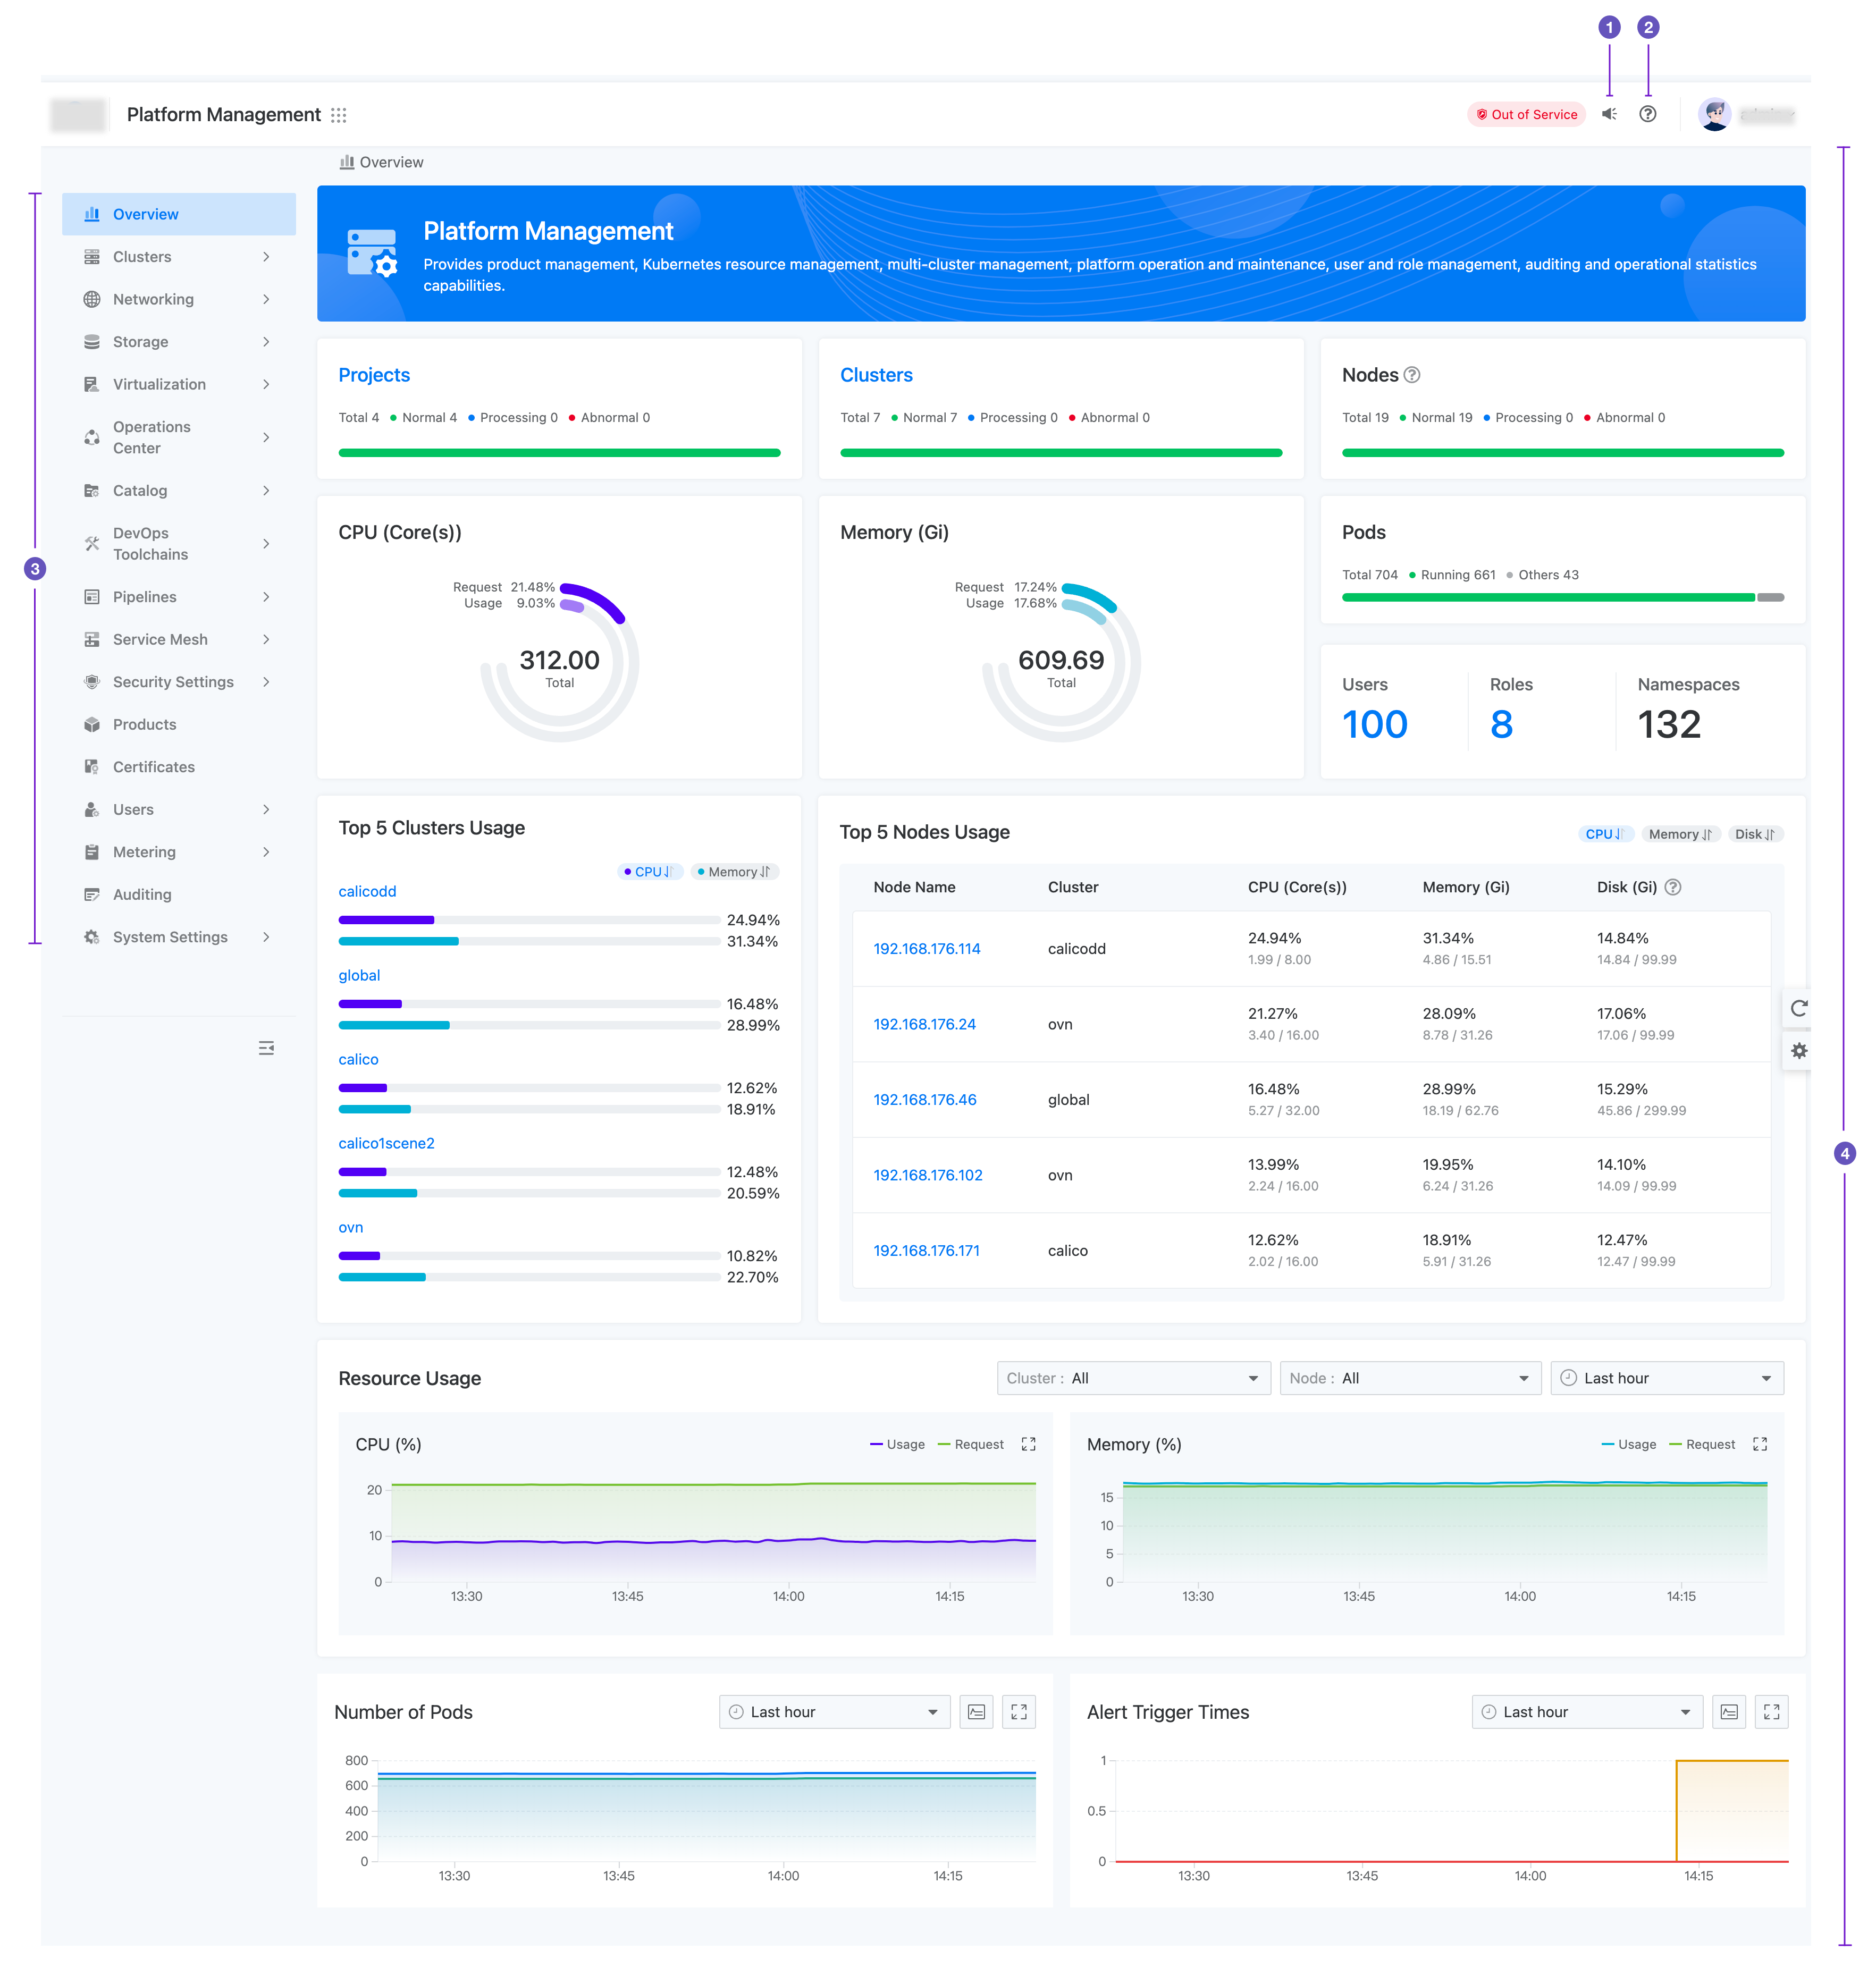
| Number | Name | Description |
|---|---|---|
| 1 | Historical Messages | Notification messages published by Platform Management. |
| 2 | Help Docs/About the Platform/Platform Health Status | |
| 3 | Function Navigation Bar | Product functionality navigation menu. |
| 4 | Function Operation Area | User operations or resource information display area. Note: When hovering over a card, you can click the  icon to view the PromQL expression; click the icon to view the PromQL expression; click the  icon to export PromQL expressions for all charts on the current page. icon to export PromQL expressions for all charts on the current page. |
Operation Permission Description
The Platform Management view is visible only to users who have Platform Management permissions, cluster management permissions, and platform audit permissions. Taking custom system roles as an example:
-
Platform Management Operator: Has all permissions to operate on resources under this view.
-
Cluster Administrator: Can view clusters within the scope of permissions, manage clusters, and resources related to clusters such as nodes, network policies, StorageClasses, load balancing configurations, etc.
-
Platform Auditor: Can view all resources on the platform along with their audit information.
Routine Operation
The following are some routine operations for common use cases on the platform:
| Routine Operation | Operation Steps | Additional Notes |
|---|---|---|
| Open Function Entry | Click the corresponding function menu item on the left navigation pane. | - |
| View Resources |
|
|
| Creating Resources |
|
When creating resources, you typically need to enter parameters related to the resource. Please refer to the functional module documentation for details. |
| Update Resources |
|
When updating resources, typically only a subset of parameters can be updated, and updating parameters that identify critical attributes of the resource, such as the resource name, is not allowed. Please refer to the create operation for updates. |
| Delete a Resource |
|
Deleting a resource is irreversible, so please proceed with caution. Typically, the interface will prompt for a second confirmation. Please follow the prompts to proceed. |
Description of Functional Maturity
Platform features can be categorized by maturity into Alpha, Beta, and GA (General Availability) versions.
Beta and GA (General Availability) features are either stable or in a stabilizing iterative process, backed by professional teams providing support and services. You can use these features in a production environment as needed.
Alpha features may have defects or serious bugs, and they are not typically enabled in a production environment. They are recommended only for environments set up for feature exploration or testing.
To help you distinguish Alpha features, the document’s left-hand menu structure will mark the relevant feature or specific function with the Alpha label, indicating which are Alpha features. For example: Create Subnet (Alpha).
For a detailed description of platform feature maturity and recommended usage, please refer to the table below:
| Version | Maturity Description | Recommended Usage |
|---|---|---|
| Alpha | - Might be defective, could contain errors, and enabling might introduce serious bugs. - Supported functionalities might be removed at any time without notice. - Changes in API, product scenarios, or interaction flow might introduce compatibility issues, which might not be announced in subsequent releases. - If a Kubernetes feature is in Alpha, the corresponding platform feature can only be Alpha. |
For private deployments, Alpha features are disabled by default. If needed, they can be enabled during deployment through the configuration parameters. Due to potential bug risks and possibly no long-term support, it’s recommended for short-term feature explorations or testing environments, like a POC (Proof Of Concept) environment. |
| Beta | - Might have defects, but all supported functionalities won’t be removed lightly. - API parameters, product design details, etc., might change with version iterations. When this happens, a migration guide to the next version will be provided. Please be cautious when making edits, as you might need to disable apps dependent on that feature. |
Beta features are enabled by default and can be disabled during deployment through configuration parameters. Subsequent versions might introduce incompatible changes, so it’s recommended for non-critical business environments. If there are multiple independent upgradable clusters, the use in a production environment can be considered. |
| GA | - Stable version of the feature, which will appear in many subsequent versions. - API parameters, product design details, etc., might change with long-term support versions. When this happens, a migration guide to the next version will be provided. |
Suitable for all environments, including production environments. |
Description of Platform Monitoring Data
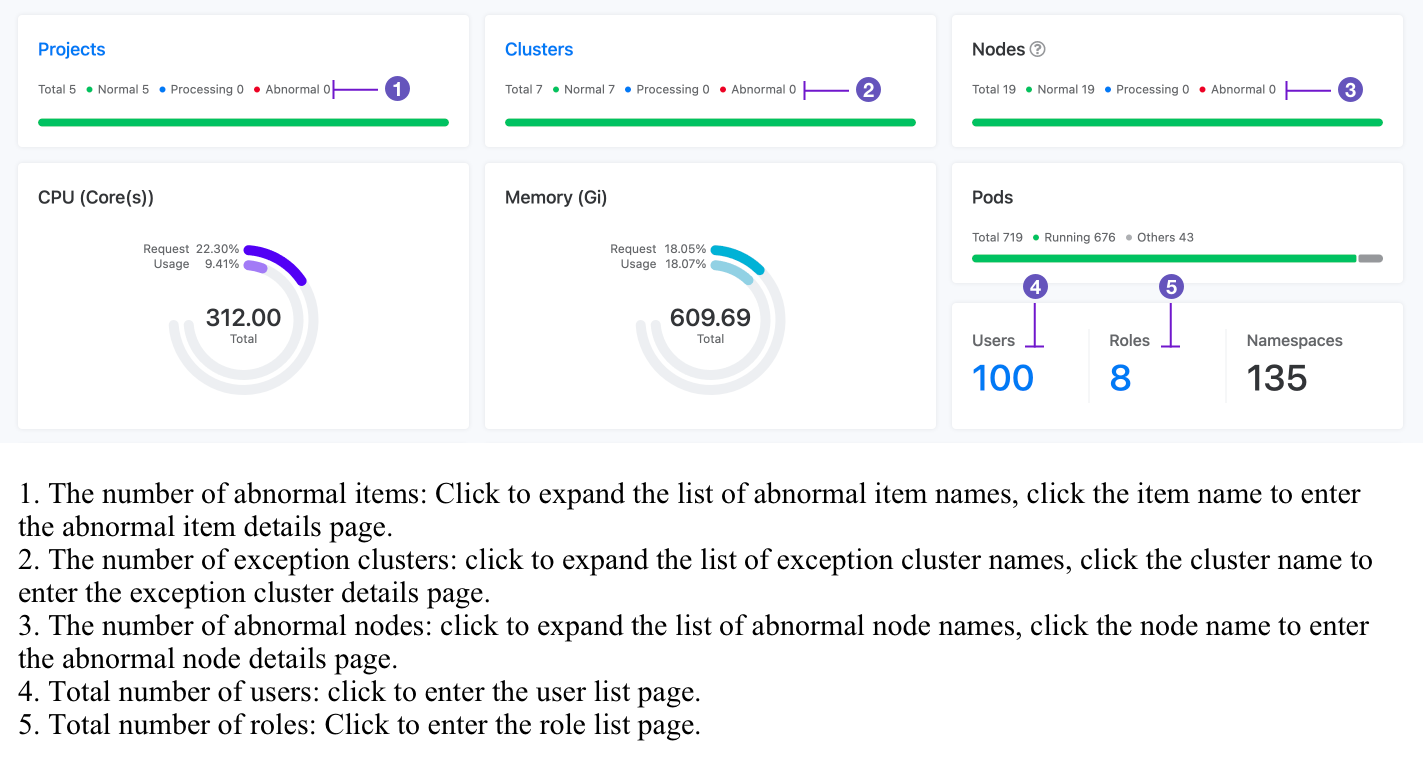
The platform’s overview feature visually displays data in sections that cover resource statistics and usage statistics. These include clusters, projects, nodes, CPU, memory, Pods, users, roles, namespaces; and usage statistics that cover the top 5 clusters in resource usage, top 5 nodes in resource usage, resource utilization rate, number of Pods, and the number of triggered alerts. It also supports the following features:
- Toggle time ranges and resource query scopes for precise data filtering.
- Quickly jump to the resource list or details page through direct links related to monitoring data.
- Show only abnormal data entries and directly jump to the corresponding details page.
Note: You can only view overview data from clusters that have deployed monitoring components.
On the overview page, you can view both resource statistics and usage statistics sections. The following explanations are provided in conjunction with illustrations.
Resource Statistics
Usage Statistics
Descriptions for the monitoring trend statistics data are as follows:
| Parameter | Description |
|---|---|
| CPU | For a specified time range, it shows the Usage Rate and Request Rate of CPU. Usage Rate = Total CPU usage of all Pods in the cluster / Total CPU of the cluster. Note: If the CPU usage rate surges at a particular time, identify the process consuming the most CPU resources. For custom Java applications, code memory leaks or infinite loops could result in high CPU usage. Request Rate = Total CPU requests from all Pods in the cluster / Total CPU of the cluster. Note: If the CPU request rate surges at a particular time, it might be due to an unreasonable overselling ratio setting for the cluster or high request values set for Pods running in the cluster, which might waste resources. |
| Memory | For a specified time range, it shows the Usage Rate and Request Rate of Memory. Usage Rate = Total memory usage of all Pods in the cluster / Total memory of the cluster. Memory is one of the critical components of a server and serves as a bridge communicating with the CPU. Memory performance significantly impacts the machine’s operation. When a program runs, it relies on memory for data loading, thread concurrency, and I/O buffering. The available memory size determines whether a program can run normally and how it runs. Request Rate = Total memory requests from all Pods in the cluster / Total memory of the cluster. Note: If the memory request rate surges at a particular time, it might be due to an unreasonable overselling ratio setting for the cluster or high request values set for Pods running in the cluster, which might waste resources. |
| Pods Count | For a specified time range, it shows the count of Pods in “Running” state and the total number of Pods in the cluster. |
| Alert Trigger Count | For a specified time range, it shows the count of triggered alerts related to clusters, nodes, and workloads. |