Configure Data services to customize alarm metrics
This section lists commonly used custom alarm metrics and their expressions for data service components, which can be used to achieve more comprehensive performance monitoring and alarm.
Attention and Suggestions
Before reading this best practice, you should have a general understanding of the platform’s common create alarm policy operation. When you start to configure custom alarm metrics for each component of the data service, please pay attention to the following:
-
The resource object monitored by the alarm policy: the stateful set corresponding to the instance.
-
In the custom alarm rule, expressions that conform to the promsql syntax are required. All examples in this section meet this requirement.
-
It is recommended to use the container group name
{{.service_name}}, the container group IP{{.instance}}, or the container group name and IP{{.service_name}} {{.instance}}as legend parameters. -
If you need to configure the same alarm policy for instances in different namespaces, please first create an alarm template and reuse the template to create alarm policies.
Common indicators and expressions
MySQL
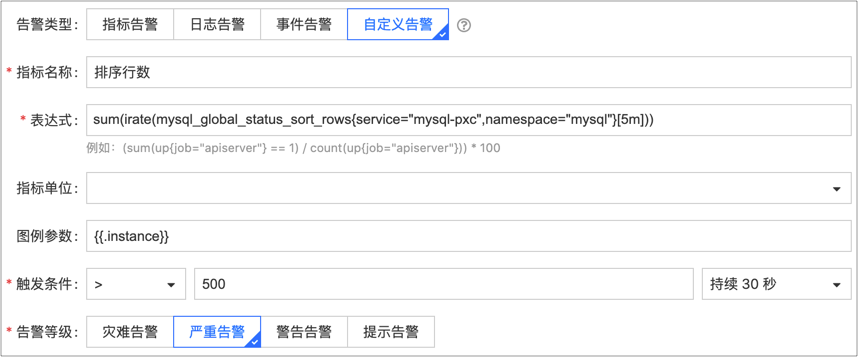
The monitoring objects of the indicators listed in this section are all MySQL nodes. If you want to monitor a MySQL cluster, you need to remove the service_name variable and add the sum function. For example, the following figure represents an alarm for the sorting rows of a MySQL cluster.
PXC Architecture
-
Naming rule for stateful replica set: {instance name}-pxc, for example mysql-pxc.
-
Naming rule for MySQL container group: {instance name}-pxc-{sequential number}, for example mysql-pxc-0.
MGR Architecture
-
Naming rule for stateful replica set: {instance name}, for example mysql.
-
Naming rule for MySQL container group: {instance name}-{sequential number}, for example mysql-0.
| Metric Name | Expression |
|---|---|
| Maximum Connection Response | max_over_time(mysql_global_status_max_used_connections{service="stateful replica set name",namespace="namespace",service_name="MySQL container group name"}[5m]) |
| Number of Connected Threads | max_over_time(mysql_global_status_threads_connected{service="stateful replica set name",namespace="namespace",service_name="MySQL container group name"}[5m]) |
| Number of Running Threads | max_over_time(mysql_global_status_threads_running{service="stateful replica set name",namespace="namespace",service_name="MySQL container group name"}[5m]) |
| Number of Immediately Released Table Locks | irate(mysql_global_status_table_locks_immediate{service="stateful replica set name",namespace="namespace",service_name="MySQL container group name"}[5m]) |
| Table lock wait count | irate(mysql_global_status_table_locks_waited{service="StatefulSet",namespace="Namespace",service_name="MySQL Container Group Name"}[5m]) |
| Number of slow queries | irate(mysql_global_status_slow_queries{service="StatefulSet Name",namespace="Namespace",service_name="MySQL Container Group Name"}[5m]) |
| Number of sorted rows | irate(mysql_global_status_sort_rows{service="StatefulSet Name",namespace="Namespace",service_name="MySQL Container Group Name"}[5m]) |
| InnoDB read requests | irate(mysql_global_status_innodb_buffer_pool_read_requests{service="StatefulSet Name",namespace="Namespace",service_name="MySQL Container Group Name"}[5m]) |
| InnoDB write requests | irate(mysql_global_status_innodb_buffer_pool_write_requests{service="StatefulSet Name",namespace="Namespace",service_name="MySQL Container Group Name"}[5m]) |
| Number of delete statements | irate(mysql_global_status_commands_total{service="StatefulSet Name",namespace="Namespace",service_name="MySQL Container Group Name",command="delete"}[5m]) |
| Number of insert statements | irate(mysql_global_status_commands_total{service="statefulset name",namespace="namespace",service_name="MySQL container group name",command="insert"}[5m]) |
| Number of replace statements | irate(mysql_global_status_commands_total{service="statefulset name",namespace="namespace",service_name="MySQL container group name",command="replace"}[5m]) |
| Number of select statements | irate(mysql_global_status_commands_total{service="statefulset name",namespace="namespace",service_name="MySQL container group name",command="select"}[5m]) |
| Number of update statements | irate(mysql_global_status_commands_total{service="statefulset name",namespace="namespace",service_name="MySQL container group name",command="update"}[5m]) |
Redis
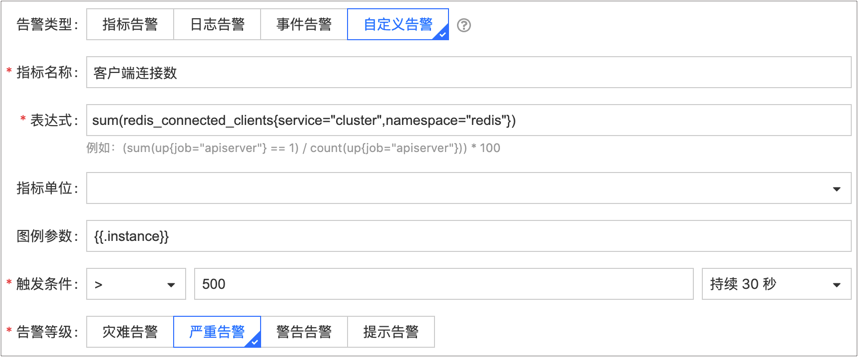
The monitoring objects for the metrics listed in this section are Redis nodes. If you want to monitor a Redis cluster, you need to remove the pod variable and add the sum function. For example, the following figure shows an alert for the number of client connections in a Redis cluster.
Redis Sentinel
-
Naming convention for Redis stateful set: rfr-{instance name}, for example rfr-sentinel.
-
Naming convention for Redis container group: rfr-{instance name}-{sequential number}, for example rfr-sentinel-0.
Redis Cluster
Naming convention for Redis container group: drc-{instance name}-{sequential number}-{sequential number}, for example rfr-sentinel-0-1.
| Metric Name | Expression |
|---|---|
| Connected Clients | redis_connected_clients{service="stateful set name (sentinel mode) or instance name (cluster mode)",namespace="namespace",pod="redis container group name"} |
| Memory Usage | redis_memory_used_bytes{service="stateful set name (sentinel mode) or instance name (cluster mode)",namespace="namespace",pod="redis container group name"}) |
| Redis Incoming Bytes | rate(redis_net_input_bytes_total{service="stateful set name (sentinel mode) or instance name (cluster mode)",namespace="namespace",pod="redis container group name"}[1m]) |
| Redis Outgoing Bytes | rate(redis_net_output_bytes_total{service="stateful set name (sentinel mode) or instance name (cluster mode)",namespace="namespace",pod="redis container group name"}[1m]) |
| Expired Keys | irate(redis_expired_keys_total{service="stateful set name (sentinel mode) or instance name (cluster mode)",namespace="namespace",pod="redis container group name"}[1m]) |
| Number of times the request key was hit | redis_keyspace_hits_total{service="StatefulSet name (Sentinel mode) or Instance name (Cluster mode)", namespace="Namespace", pod="Redis container group name"} |
| Total number of processed requests | irate(redis_commands_processed_total{service="StatefulSet name (Sentinel mode) or Instance name (Cluster mode)", namespace="Namespace", pod="Redis container group name"}[1m]) |
| Number of key evictions | irate(redis_evicted_keys_total{service="StatefulSet name (Sentinel mode) or Instance name (Cluster mode)", namespace="Namespace", pod="Redis container group name"}[1m]) |
| Number of slow logs | rate(redis_slowlog_length{service="StatefulSet name (Sentinel mode) or Instance name (Cluster mode)", namespace="Namespace", pod="Redis container group name"}[1m]) |
Kafka
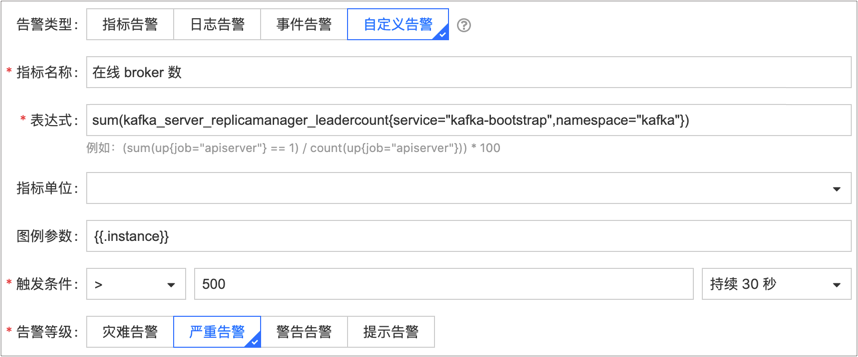
The monitoring objects of the metrics listed in this section are all Kafka nodes. If you want to monitor a Kafka cluster, you need to remove the pod variable and add the sum function. For example, the following figure represents an alert for the number of online brokers in a Kafka cluster.
-
Naming convention for StatefulSet: {Kafka instance name}-bootstrap, for example, kafka-bootstrap.
-
Naming convention for Kafka container group: {Kafka instance name}-{sequential number}, for example, kafka-0.
| Metric Name | Expression |
|---|---|
| Online Broker Count | kafka_server_replicamanager_leadercount{service="StatefulSet Name",namespace="Namespace",pod="Kafka Container Group Name"} |
| Active Controller Count | kafka_controller_kafkacontroller_activecontrollercount{service="StatefulSet Name",namespace="Namespace",pod="Kafka Container Group Name"} |
| Contentious Leader Election Count | irate(kafka_controller_controllerstats_uncleanleaderelections_total{service="StatefulSet Name",namespace="Namespace",pod="Kafka Container Group Name"}[5m]) |
| Partition Count | kafka_server_replicamanager_partitioncount{service="StatefulSet Name",namespace="Namespace",pod="Kafka Container Group Name"} |
| Incoming Traffic | irate(kafka_server_brokertopicmetrics_bytesin_total{service="StatefulSet Name",namespace="Namespace",pod="Kafka Container Group Name"}[1m]) |
| Outgoing Traffic | irate(kafka_server_brokertopicmetrics_bytesout_total{service="StatefulSet Name",namespace="Namespace",pod="Kafka Container Group Name"}[1m]) |
RabbitMQ
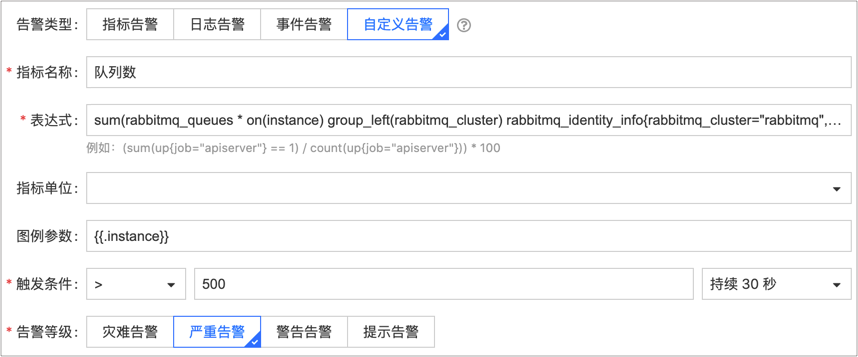
The monitoring objects for the metrics listed in this section are RabbitMQ nodes. If you want to monitor a RabbitMQ cluster, you need to remove the pod variable and add the sum function. For example, the following figure represents an alert for the number of queues in a RabbitMQ cluster.
The naming convention for RabbitMQ container groups is: {RabbitMQ instance name}-server-{ordered number}, for example, rabbitmq-server-0.
| Metric Name | Expression |
|---|---|
| Incoming Message Count | rate(rabbitmq_channel_messages_published_total[60s]) * on(instance) group_left(rabbitmq_cluster) rabbitmq_identity_info{rabbitmq_cluster="instance name", namespace="namespace",pod="RabbitMQ container group name"} |
| Number of Connections | rabbitmq_connections * on(instance) group_left(rabbitmq_cluster) rabbitmq_identity_info{rabbitmq_cluster="instance name", namespace="namespace",pod="RabbitMQ container group name"} |
| Number of Channels | rabbitmq_channels * on(instance) group_left(rabbitmq_cluster) rabbitmq_identity_info{rabbitmq_cluster="instance_name", namespace="namespace_name",pod="RabbitMQ_container_group_name"} |
| Number of Queues | rabbitmq_queues * on(instance) group_left(rabbitmq_cluster) rabbitmq_identity_info{rabbitmq_cluster="instance_name", namespace="namespace_name",pod="RabbitMQ_container_group_name"} |