Details
The platform can retain usage details data for nearly 18 months and supports querying visualized report details data for custom time ranges (within the last 31 days).
You can filter the statistics based on metrics (such as Pods usage and Pods quota), project name, associated cluster, and namespace under the cluster. Additionally, you can click on Export Results to export the filtered statistics data as a CSV format report.
Prerequisites
If you need to export statistical reports, you need to configure storage for operational statistics during platform deployment.
Procedure of operation
-
In the left navigation pane, click Metering > Details.
Or: On the Reports page, when the Metrics are set to
Pod QuotaorPod Usage, click the Details button on the right side of a single query result record to enter the measurement details page and view the detailed data. -
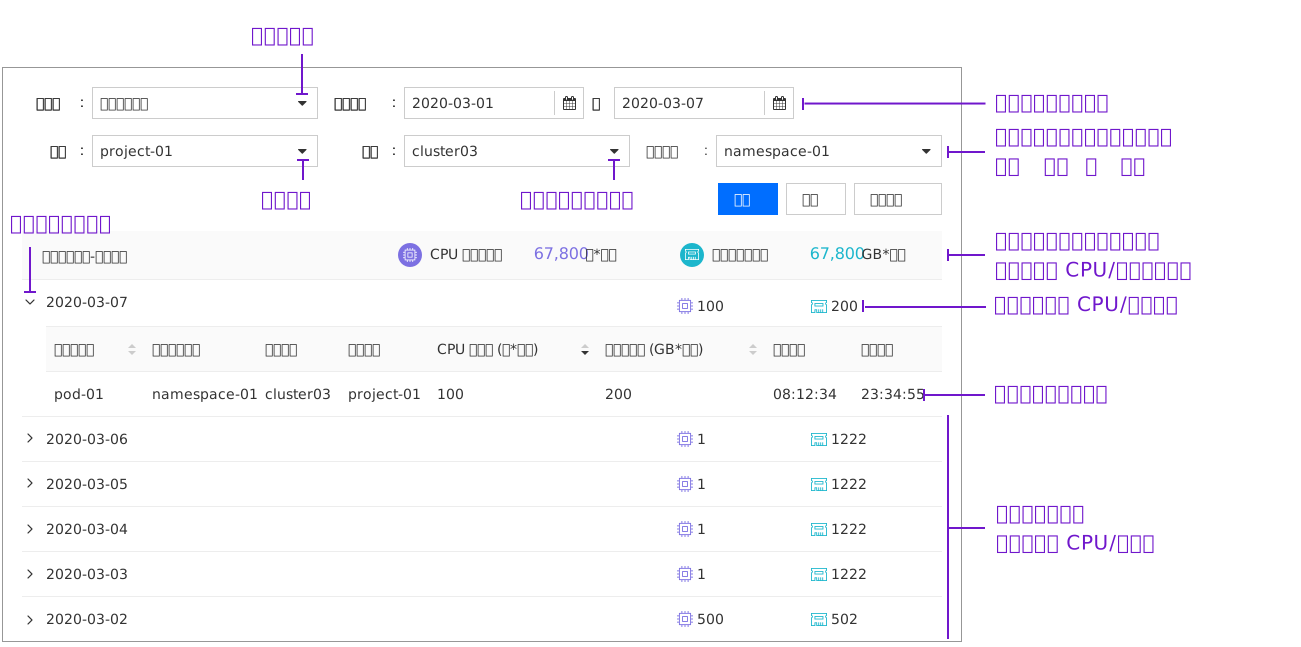
Refer to the instructions in the following figure, select the statistical time range, statistical items, projects, clusters, and namespaces, and then click the Search button to view the corresponding usage details data.
Note:
-
The Kubernetes (K8s) infrastructure and cloud-native industry translation work is now starting. Please forget about the previous work and focus on translating the following content into English. Please retain the original markdown syntax, such as starting with “* " or “1. “. Only output the English translation based on the content I provided, and do not generate any unrelated content.
-
The platform retains data only within the last 18 months. For a single query, the maximum supported time range is 31 days.
-
Pod Usage: The total sum calculated by taking the average of the actual usage of Pods every 5 minutes.
-
Pod Quota: Counted based on the size of the Pod’s request value.
-
Support sorting by Pods name (alphabetical order), total CPU usage (size), and total memory usage (size).
-