Create probe
Create black box monitoring items, which can choose ICMP, TCP, and HTTP detection methods, and regularly probe the network of the specified target address.
Prerequisites
The cluster has deployed monitoring components and the monitoring components are running normally.
Procedure of operation
-
In the left navigation bar, click Operations center > Monitoring > Probes.
Note: Black box monitoring is a cluster-scoped feature. Click on the cluster switch entry in the top navigation bar to switch between clusters.
-
Click Create probe.
-
Refer to the following instructions to configure the relevant parameters.
Parameter Description Detection Method ICMP: Ping the domain name or IP address entered in the Target Address to detect the server’s availability.
TCP: Listen to the port in the<domain name:port>or<IP:port>entered in the Target Address to detect the availability of the host’s business port.
HTTP: Detect the website’s connectivity by entering the URL address in the Target Address.
Note: The HTTP detection method only supports GET requests by default. If you need to use POST requests, please refer to Custom BlackboxExporter Monitoring Module .Detection Interval The interval between detections. Target Address The target address for detection, up to 128 characters.
For different detection methods, the input format requirements for the target address are different:
ICMP: Domain name or IP address, for example:10.165.94.31.
TCP:<domain name:port>or<IP:port>, for example:172.19.155.133:8765.
HTTP: Website URL address starting with http or https, for example:http://alauda.cn/. -
Click Create.
After successful creation, you can view the latest probe results in real time on the list page. You can also create alert policies based on black box monitoring items here . When a failure is detected, an alert will be automatically triggered to notify relevant personnel to fix the issue.Note: After the black box monitoring item is successfully created, the system needs about 5 minutes to synchronize the configuration. During the synchronization period, no detection will be performed and the detection results cannot be viewed.
Creating Black Box Alerts
pre-conditions
-
The cluster has deployed the monitoring component and the monitoring component is functioning properly.
-
The black box monitoring item has been created successfully and has waited for the system synchronisation configuration to complete, the black box monitoring page can view the detection results.
操作步骤
-
In the left navigation bar, click Operation and Maintenance Centre > Alerts > Alert Policy.
Hint: The alert policy is a cluster level function, click the cluster switching portal in the navigation bar above to switch clusters. Please note that you can switch to the cluster for which you have just configured blackbox monitoring items.
-
Click Create Alert Policy.
-
Refer to the following instructions to configure the relevant parameters, and refer to [Creating an Alert Policy] for more information on the parameters(/en/platform-usermanual/ops/7alarmall/10alarm/1alarmcreate/)
-
Alarm type Please select Resource type alarm
-
Resource Type Please select Cluster
-
Click on Add Alert Rule.
-
Alarm type Please select Black box alarm
-
Black Box Monitor Please select the black box monitor you wish to configure.
-
Metrics name Please select the metrics you wish to monitor and alert on, the current metrics supported by the platform are Connectivity and HTTP Return Code.
-
Connectivity: This indicator is available for all black box monitoring items, the "! = 1" means that the target address of the black box monitoring item cannot be connected.
-
HTTP return code: you can select this indicator when the blackbox monitoring item detection method is HTTP, and you can fill in three positive integers in the trigger condition, for example, the trigger condition is configured as "> 299", which means that the return code will be alarmed when the return code is 3XX, 4XX, 5XX.
-
-
Notification Policy Please select the policy that you have preconfigured in advance, if not, please refer to [Notification Policy].(/en/platform-usermanual/ops/8notification/50notification/)
-
Click Add
-
- Click Create and the alert policy is submitted, you can see this alert policy in the list of alert policies.
Custom BlackboxExporter monitoring module
By adding custom monitoring modules to the configuration file of BlackboxExporter, it is possible to implement the detection method defined by the module and enhance the functionality of black box monitoring.
For example, after adding the http_post_2xx module to the configuration file, when the detection method of black box monitoring is HTTP, the status of POST request methods can be detected.
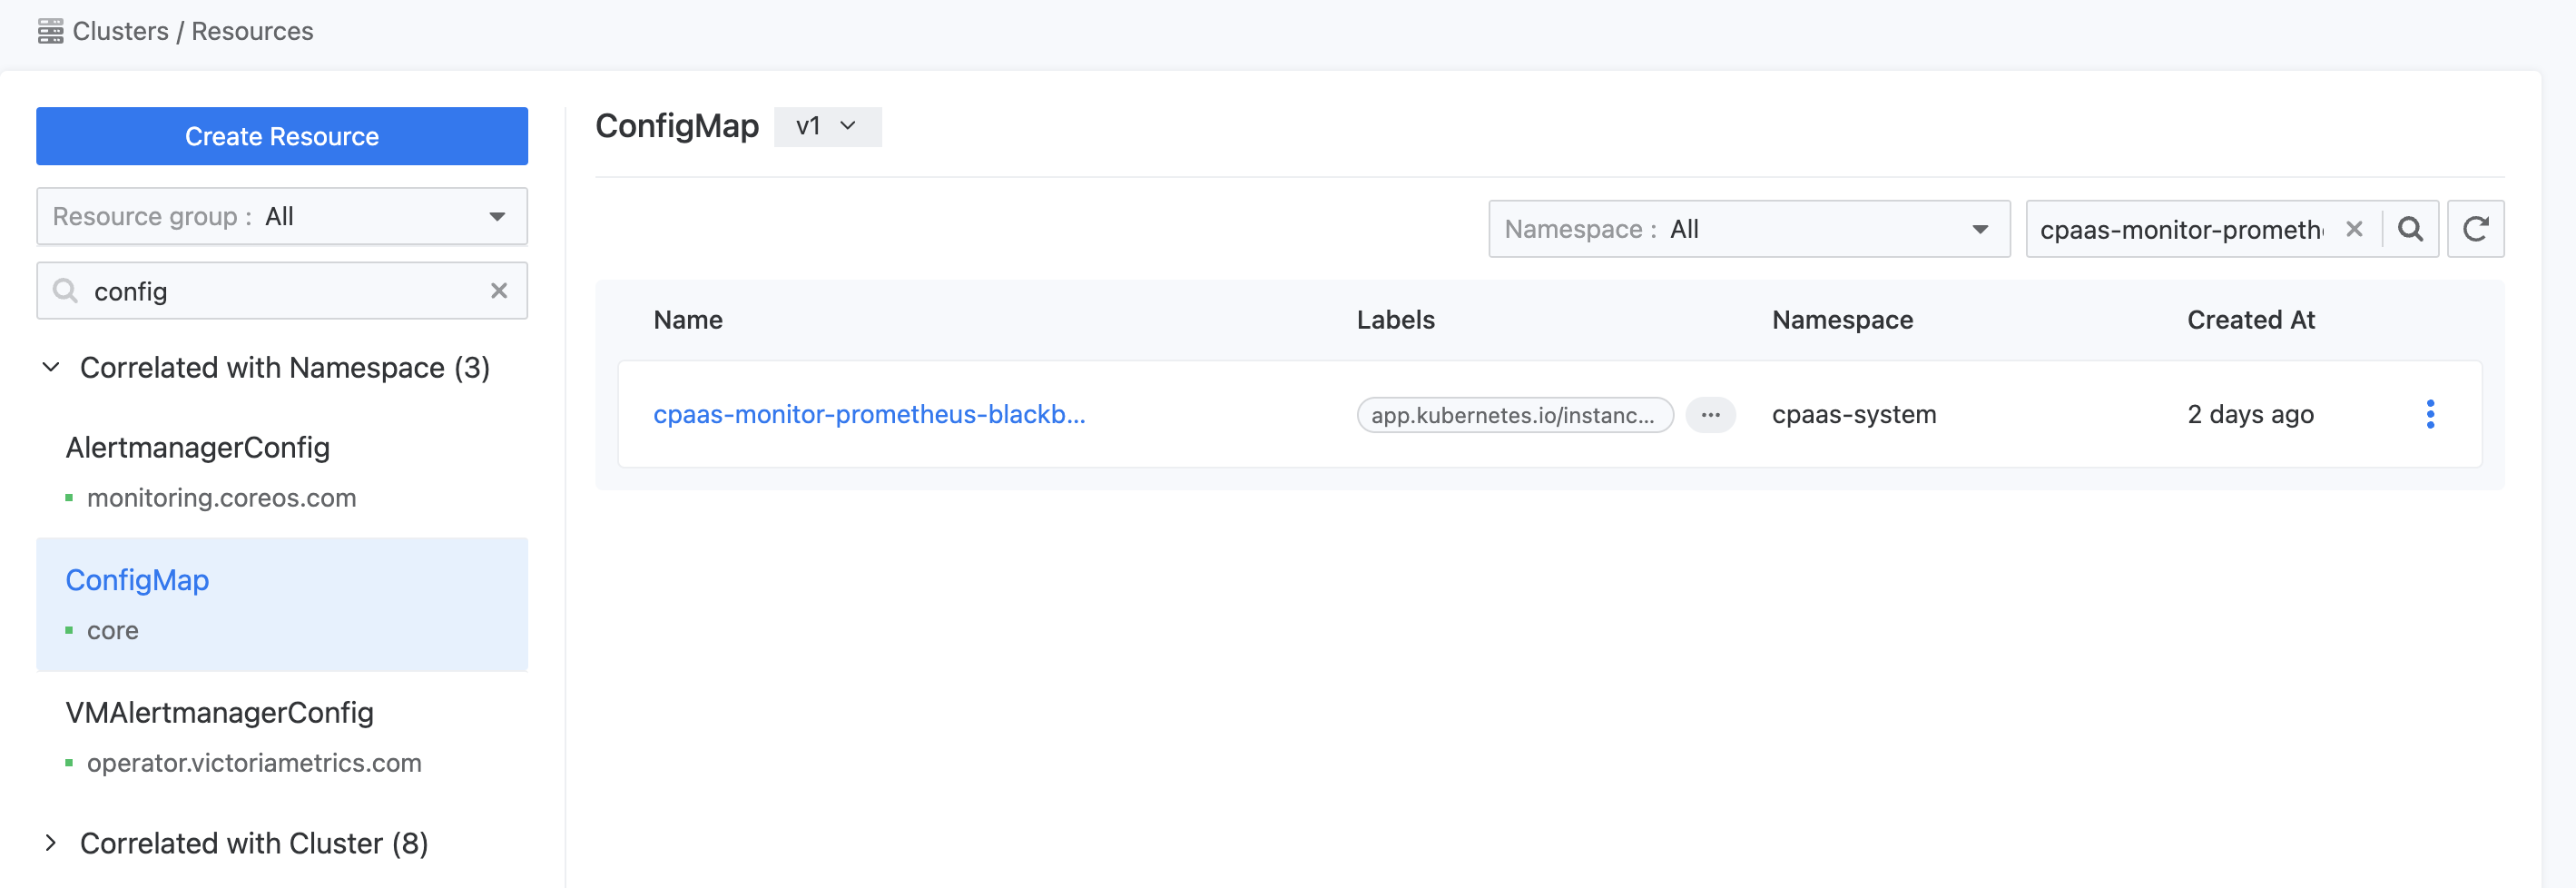
Note: The configuration file for blackbox monitoring is located in the namespace where the Prometheus component of the cluster is located. The default name is cpaas-monitor-prometheus-blackbox-exporter, but it can be modified. Please refer to the actual name for accuracy.
This configuration file is a namespace-specific ConfigMap resource and can be quickly viewed and updated through the Cluster Management > Resource Management feature in Platform Management. See the following image.
Procedure of operation
-
Update the configuration file for black box monitoring to add custom monitoring modules for the key
modules.Taking the http_post_2xx module as an example, let’s explain.
  blackbox.yaml: |
    modules:
      http_post_2xx:                    # http_post Probe module
        prober: http
        timeout: 5s
        http:
          method: POST                 # Probe request method
          headers:
            Content-Type: application/json
          body: '{}'                   # Carried during probe body Content
The complete YAML example of the configuration file for black-box monitoring can be found in the reference information .
-
Choose one of the following methods to make the configuration take effect.
-
Restart the Pod of the Blackbox Exporter component cpaas-monitor-prometheus-blackbox-exporter to remove it.
-
Execute the following command to invoke the reload API and reload the configuration file:
curl -X POST -v <Pod IP>:9115/-/reload
-
Reference information
The example of a complete YAML configuration file for black-box monitoring is as follows:
apiVersion: v1
data:
  blackbox.yaml: |
    modules:
      http_2xx_example:               # HTTP probe example
        prober: http
        timeout: 5s                   # Probe timeout duration
        http:
          valid_http_versions: ["HTTP/1.1", "HTTP/2.0"]                   # Valid HTTP versions in response, usually defaults
          valid_status_codes: []  # Defaults to 2xx                       # Valid status code range, if the response falls within this range, it's considered a successful probe
          method: GET                 # Request method
          headers:                    # Request headers
            Host: vhost.example.com
            Accept-Language: en-US
            Origin: example.com
          no_follow_redirects: false  # Whether to allow redirects
          fail_if_ssl: false
          fail_if_not_ssl: false
          fail_if_body_matches_regexp:
            - "Could not connect to database"
          fail_if_body_not_matches_regexp:
            - "Download the latest version here"
          fail_if_header_matches: # Verifies that no cookies are set
            - header: Set-Cookie
              allow_missing: true
              regexp: '.*'
          fail_if_header_not_matches:
            - header: Access-Control-Allow-Origin
              regexp: '(\*|example\.com)'
          tls_config:                  # TLS configuration for HTTPS requests
            insecure_skip_verify: false
          preferred_ip_protocol: "ip4" # defaults to "ip6"                 # Preferred IP protocol version
          ip_protocol_fallback: false  # no fallback to "ip6"
      http_post_2xx:                   # HTTP probe example with body
        prober: http
        timeout: 5s
        http:
          method: POST                 # Probe request method
          headers:
            Content-Type: application/json
          body: '{"username":"admin","password":"123456"}'                   # Body to be sent during the probe
      http_basic_auth_example:         # Example of a probe with basic authentication
        prober: http
        timeout: 5s
        http:
          method: POST
          headers:
            Host: "login.example.com"
          basic_auth:                  # Username and password to be added during the probe
            username: "username"
            password: "mysecret"
      http_custom_ca_example:
        prober: http
        http:
          method: GET
          tls_config:                  # Specifies the root certificate to be used during the probe
            ca_file: "/certs/my_cert.crt"
      http_gzip:
        prober: http
        http:
          method: GET
          compression: gzip            # Compression method to be used during the probe
      http_gzip_with_accept_encoding:
        prober: http
        http:
          method: GET
          compression: gzip
          headers:
            Accept-Encoding: gzip
      tls_connect:                     # TCP probe example
        prober: tcp
        timeout: 5s
        tcp:
          tls: true                    # Whether to use TLS
      tcp_connect_example:
        prober: tcp
        timeout: 5s
      imap_starttls:                   # Example for probing IMAP email server configuration
        prober: tcp
        timeout: 5s
        tcp:
          query_response:
            - expect: "OK.*STARTTLS"
            - send: ". STARTTLS"
            - expect: "OK"
            - starttls: true
            - send: ". capability"
            - expect: "CAPABILITY IMAP4rev1"
      smtp_starttls:                   # Example for probing SMTP email server configuration
        prober: tcp
        timeout: 5s
        tcp:
          query_response:
            - expect: "^220 ([^ ]+) ESMTP (.+)$"
            - send: "EHLO prober\r"
            - expect: "^250-STARTTLS"
            - send: "STARTTLS\r"
            - expect: "^220"
            - starttls: true
            - send: "EHLO prober\r"
            - expect: "^250-AUTH"
            - send: "QUIT\r"
      irc_banner_example:
        prober: tcp
        timeout: 5s
        tcp:
          query_response:
            - send: "NICK prober"
            - send: "USER prober prober prober :prober"
            - expect: "PING :([^ ]+)"
              send: "PONG ${1}"
            - expect: "^:[^ ]+ 001"
      icmp_example:                    # Example of ICMP probe configuration
        prober: icmp
        timeout: 5s
        icmp:
          preferred_ip_protocol: "ip4"
          source_ip_address: "127.0.0.1"
      dns_udp_example:                 # Example of DNS query using UDP
        prober: dns
        timeout: 5s
        dns:
          query_name: "www.prometheus.io"                 # Domain name to resolve
          query_type: "A"              # Type corresponding to the domain
          valid_rcodes:
          - NOERROR
          validate_answer_rrs:
            fail_if_matches_regexp:
            - ".*127.0.0.1"
            fail_if_all_match_regexp:
            - ".*127.0.0.1"
            fail_if_not_matches_regexp:
            - "www.prometheus.io.\t300\tIN\tA\t127.0.0.1"
            fail_if_none_matches_regexp:
            - "127.0.0.1"
          validate_authority_rrs:
            fail_if_matches_regexp:
            - ".*127.0.0.1"
          validate_additional_rrs:
            fail_if_matches_regexp:
            - ".*127.0.0.1"
      dns_soa:
        prober: dns
        dns:
          query_name: "prometheus.io"
          query_type: "SOA"
      dns_tcp_example:               # Example of DNS query using TCP
        prober: dns
        dns:
          transport_protocol: "tcp" # defaults to "udp"
          preferred_ip_protocol: "ip4" # defaults to "ip6"
          query_name: "www.prometheus.io"
kind: ConfigMap
metadata:
  annotations:
    skip-sync: "true"
  labels:
    app.kubernetes.io/instance: cpaas-monitor
    app.kubernetes.io/managed-by: Tiller
    app.kubernetes.io/name: prometheus-blackbox-exporter
    helm.sh/chart: prometheus-blackbox-exporter-1.6.0
  name: cpaas-monitor-prometheus-blackbox-exporter
  namespace: cpaas-system