Cluster Monitoring
When self-built or connected clusters on the platform have deployed monitoring components and the monitoring components are running normally, you can view cluster monitoring data through a visual interface.
-
Cluster Overview: View basic resource monitoring information of the cluster, including resource status, resource usage, resource trend statistics, network load statistics, and network health status.
-
View Component Monitoring Data: View monitoring information of cluster control components to understand the running status and resource usage of the components in real-time.
Prerequisites
-
Cluster status is normal.
-
Monitoring components are deployed in the cluster and running normally.
Monitoring Data Operation Instructions
-
Control Refresh: The monitoring data on the cluster overview and monitoring pages automatically refresh once when the page is opened. To refresh the monitoring data again, you can do so in two ways:
-
Manual Refresh: Click on
 at the bottom right of the page to manually refresh the monitoring data;
 -
Set Auto-Refresh (default off): Click on
 to set the time interval for auto-refreshing the monitoring data.
-
-
View Large Chart: Click on
 at the top right of the chart to view an enlarged chart with refined data display granularity.
 -
View/Set Legend: Click on
 at the top right of the chart to expand the legend in the monitoring chart. Click on a legend to hide/show the corresponding curve in the chart.
 -
View PromQL Expression: Hover over a chart and click on
 icon to view the PromQL expression.
Cluster Overview
-
In the left navigation bar, click Clusters > Cluster of clusters.
-
Click on the cluster name to be viewed.
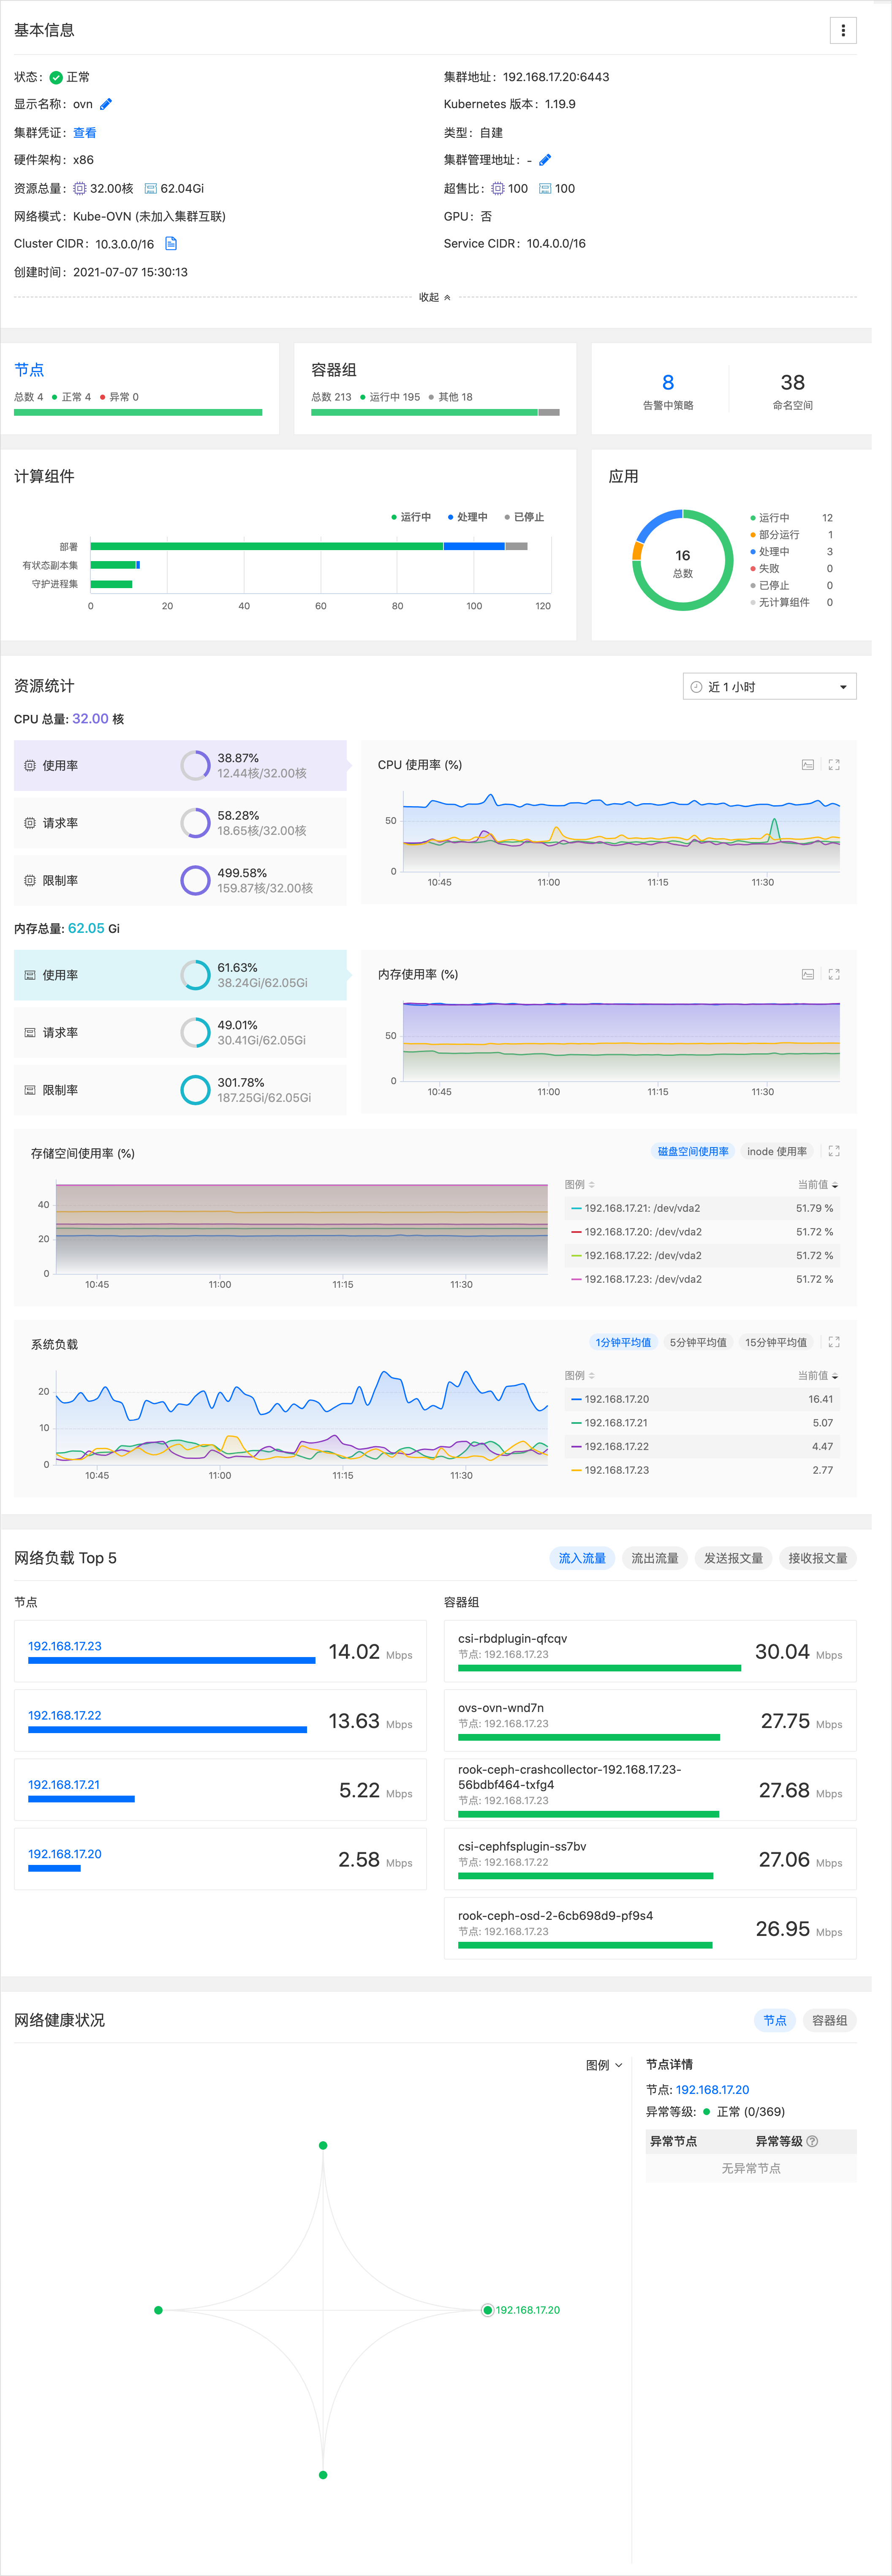
On the overview page, you can view basic information about the cluster, resource status on the cluster, current resource usage statistics, and corresponding trend statistical charts.
Explanation of resource statistics:
-
Utilization Rate = Resource usage value / Total resource value
-
Request Rate = Resource request value / Total resource value
-
Allocation Rate = Allocated resource value / Total resource value
-
System Load: Average CPU load in 1 minute, 5 minutes, and 15 minutes. It reflects the system’s busyness by comparing the number of processes currently being executed or waiting to be executed by the CPU with the maximum number of processes that the CPU can execute.
-
View Component Monitoring Data
You can view monitoring information of core Kubernetes components in the cluster to help Platform Management personnel or cluster operators understand the running status and resource usage of the components in real-time, avoiding disruptions to cluster functionality due to abnormal component states.
Procedure of Operation
-
Click on the Monitoring tab at the top of the page to access the monitoring information page of the cluster components.
Tip: Click on the secondary tabs named after the components to switch to the corresponding component’s monitoring information page.
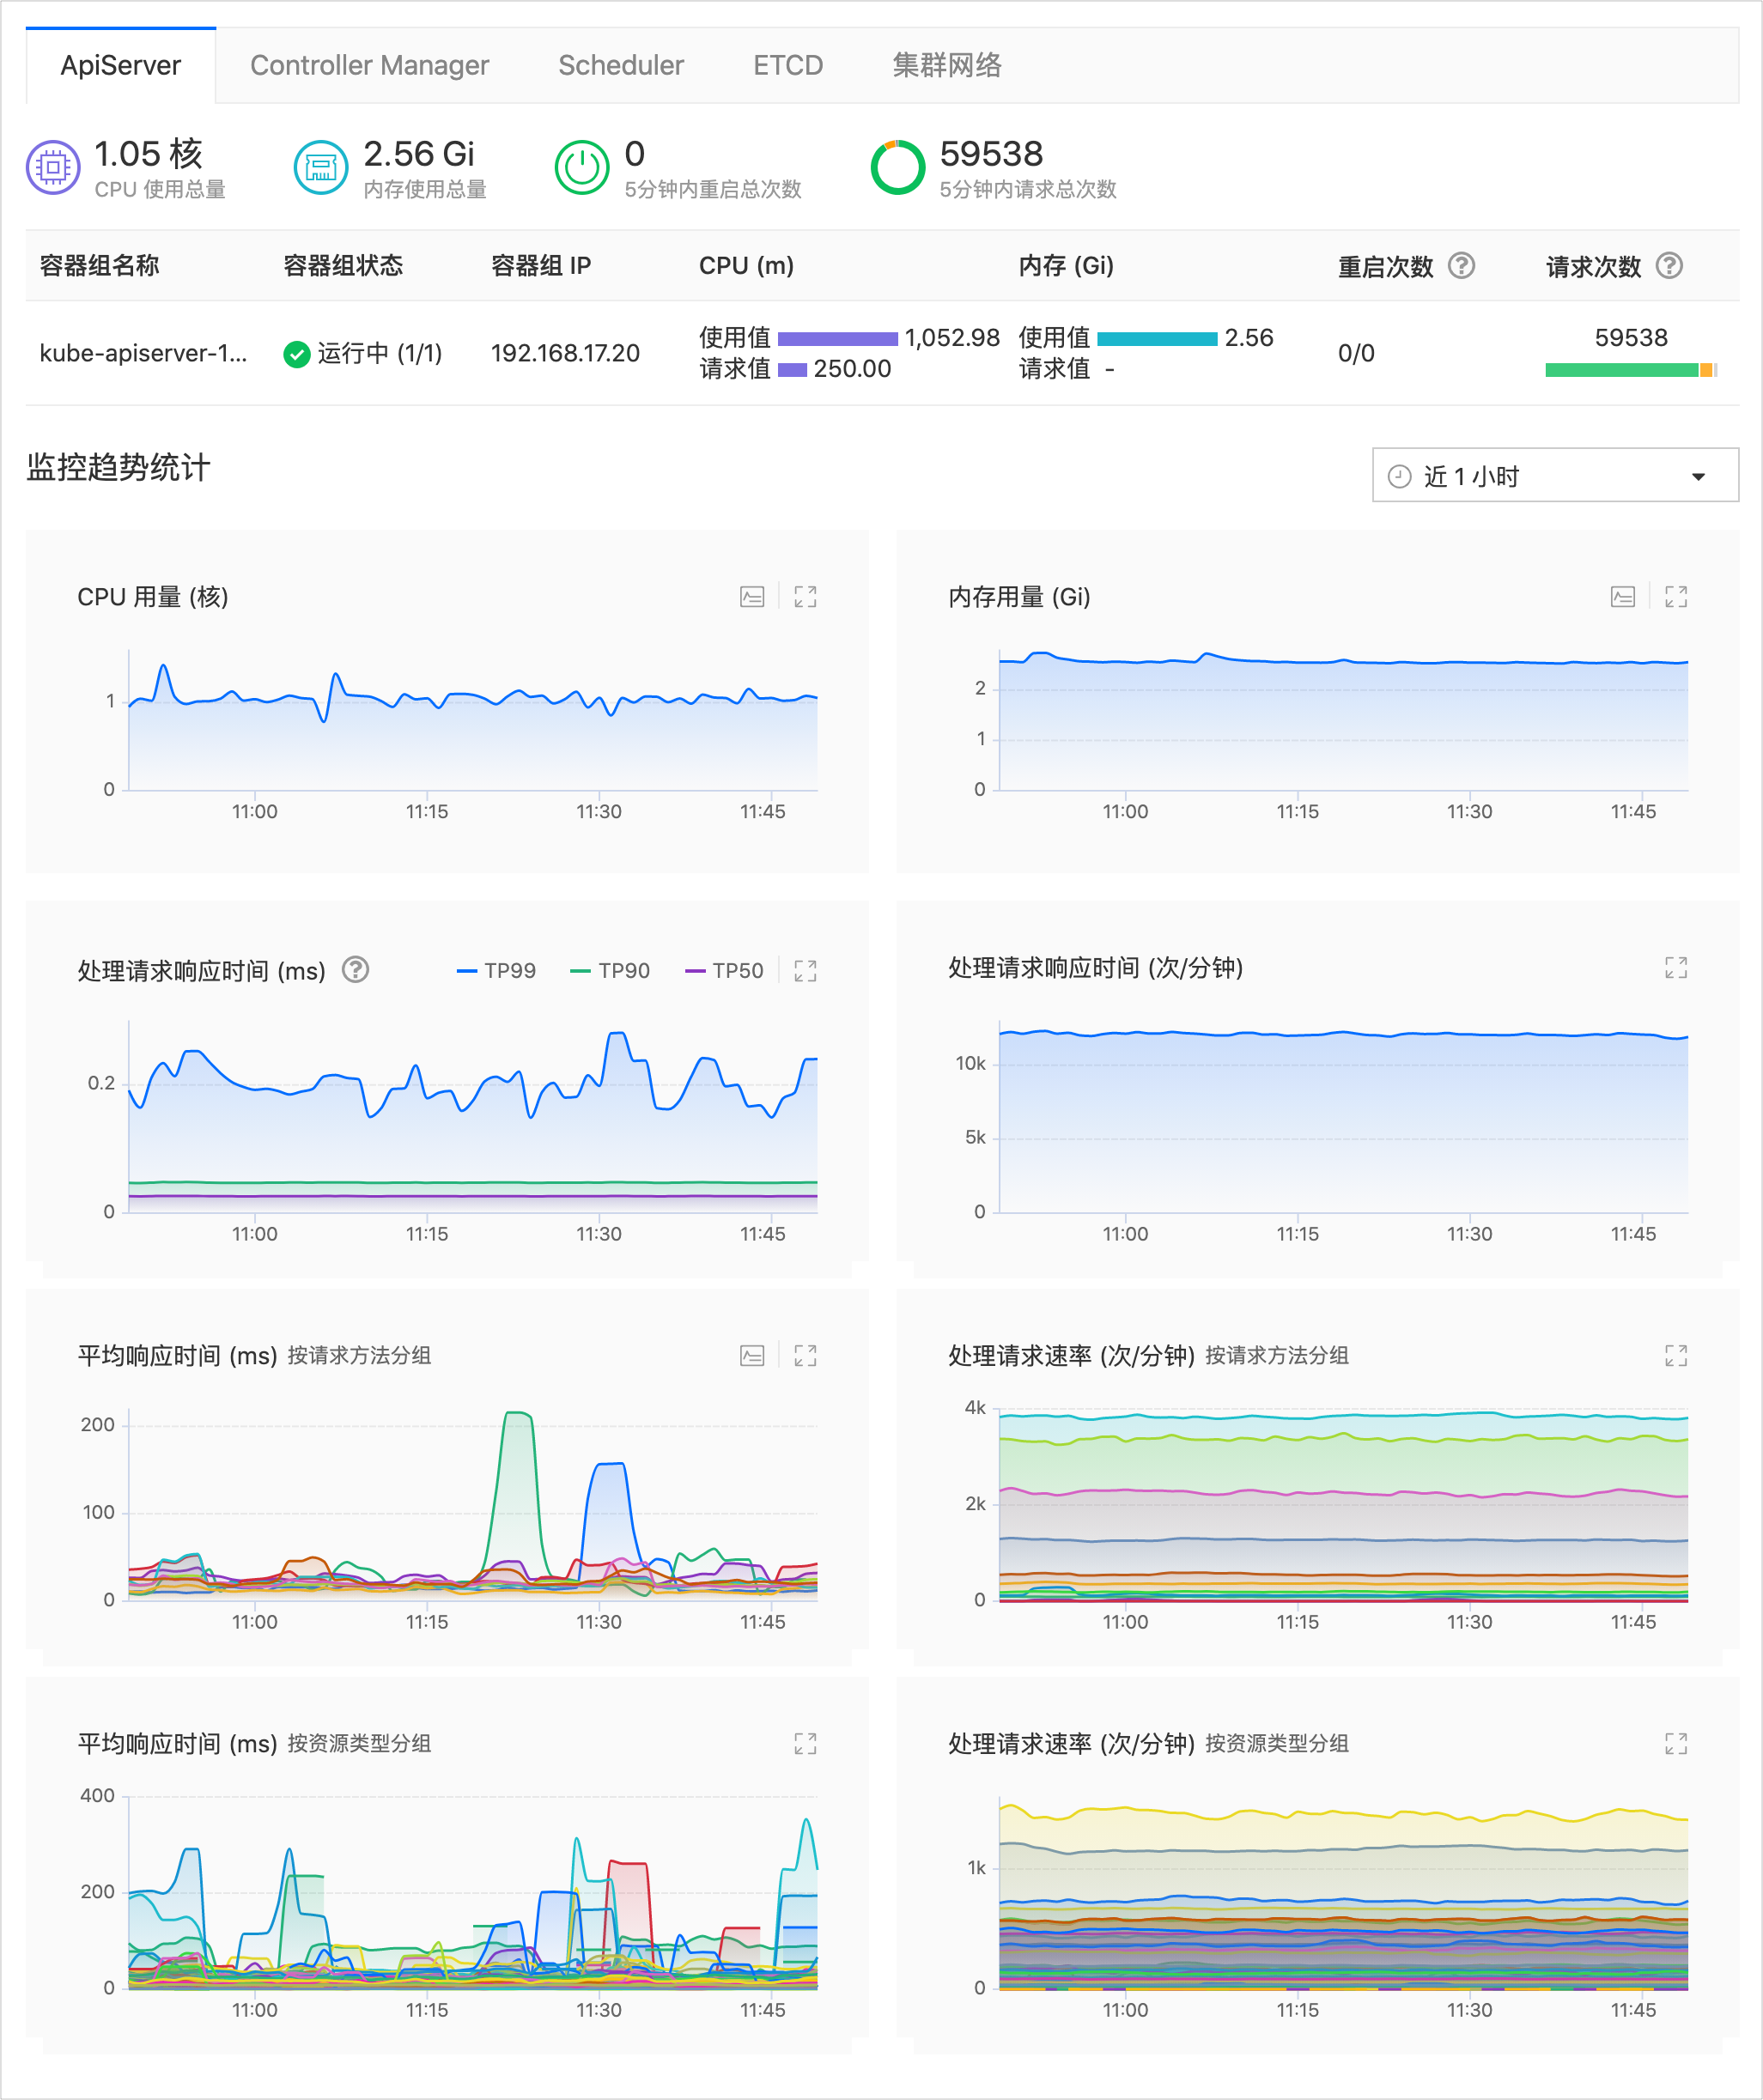
The monitoring information for each component mainly consists of Monitoring Overview, Component Pods List, and Monitoring Trend Statistics, as shown in the image below (using ApiServer as an example). Detailed explanations of monitoring information can be found in the Reference Information .
Currently, components that support viewing monitoring overview and monitoring trend statistics data include:
-
ApiServer : Provides various HTTP Rest APIs for Kubernetes resource objects such as POST, DELETE, PUT, GET, and WATCH, serving as the data bus and data center for the entire system.
-
Controller Manager : Acts as the management control center within the cluster, responsible for managing nodes, Pod replicas, service endpoints, namespaces, service accounts, and resource quotas within the cluster. In case of a node failure, the Controller Manager promptly detects it and executes automated recovery processes to ensure the cluster operates as expected.
-
Scheduler : Operates on the master node and its core function is to listen to the apiserver to obtain Pods with
PodSpec.NodeNameempty, creating a binding for each such Pod to indicate which node it should be scheduled on. -
ETCD : A highly available distributed
key-valuestorage system providing features like data TTL expiration, data change monitoring, multi-values, directory watching, distributed lock atomic operations, used for service discovery, shared configuration, managing cluster node statuses, and ensuring node data consistency.
-
Reference Information
ApiServer
Below are the monitoring information field explanations related to the ApiServer component.
Table: ApiServer Monitoring Overview
| Parameter | Description |
|---|---|
| Total CPU Usage | Total CPU usage by Pods running the component. |
| Total Memory Usage | Total memory usage by Pods running the component. |
| Total Restarts in 5 Minutes | Total number of restarts by Pods running the component in the last 5 minutes.  : Restarts = 0; : Restarts = 0;  : 1 <= Restarts <= 3; : 1 <= Restarts <= 3;  : Restarts > 3. : Restarts > 3. |
| Total Requests in 5 Minutes | Total number of HTTP requests received by Pods running the component in the last 5 minutes. |
Table: ApiServer Pods List
| Parameter | Description |
|---|---|
| Pod Name | Name of the Pods. |
| Pod Status | Status of the Pods. Running: All containers in Pods are running normally. Pending: Some containers in Pods are not in a running state. Succeeded: Pods have completed execution; Failed: Containers in Pods have failed to run. |
| Pod IP | IP address of the Pods. |
| CPU (Cores) | Amount of CPU used by Pods (usage value) and CPU request value (requests.cpu). Pods cannot start normally if available resources on nodes are less than the CPU request value of Pods. |
| Memory (Gi) | Amount of memory used by Pods (usage value) and memory request value (requests.memory). Pods cannot start normally if available resources on nodes are less than the memory request value of Pods. |
| Restart Count | Number of restarts by Pods in the last 5 minutes and total restarts since Pod creation. |
| Request Count | Number of HTTP requests received by Pods in the last 5 minutes. |
Table: ApiServer Monitoring Trend Statistics
| Parameter | Description |
|---|---|
| CPU Usage | The CPU usage of Pods running the component within a specified time range. Hovering over the line chart will display the CPU usage values of each Pod at specific time points. |
| Memory Usage | The memory usage of Pods running the component within a specified time range. Hovering over the line chart will display the memory usage values of each Pod at specific time points. |
| Request Response Time (ms) | The average response time of component request processing based on TP99, TP90, and TP50 performance metrics within a specified time range. TP99: The minimum time required for 99% of network requests to be satisfied; TP90: The minimum time required for 90% of network requests to be satisfied; TP50: The minimum time required for 50% of network requests to be satisfied. |
| Request Rate (per minute) | The average rate at which the component processes requests within a specified time range. Grouped by Request Method: Statistics on the average processing request rate based on the type of request method, with each method represented by a curve. For example: WATCH, CREATE, DELETE, GET, POST, PATCH, PUT, UPDATE, LIST; Grouped by Resource: Statistics on the request processing rate for all resources, with each resource represented by a curve. |
| Average Response Time (ms) | The average response time of component request processing within a specified time range. Grouped by Request Method: Statistics on the average response time based on the type of request method, with each method represented by a curve. For example: WATCH, CREATE, DELETE, GET, POST, PATCH, PUT, UPDATE, LIST; Grouped by Resource Type: Statistics on the average response time based on resource type within the specified time range, with each resource type represented by a curve. |
Controller Manager
Explanation of monitoring information fields related to the Controller Manager component is provided in the following table.
Table: Controller Manager Monitoring Overview
| Parameter | Description |
|---|---|
| Total CPU Usage | Total CPU usage by Pods running the component. |
| Total Memory Usage | Total memory usage by Pods running the component. |
| Total Restarts in 5 Minutes | Total number of restarts by Pods running the component in the last 5 minutes. : Restarts = 0; : 1 <= Restarts <= 3; : Restarts > 3. |
Table: Controller Manager Pods List
| Parameter | Description |
|---|---|
| Pod Name | Name of the Pod. |
| Pod Status | Status of the Pod. Running: All containers in the Pod are in a normal running state. Pending: Some containers in the Pod are not in a running state. Succeeded: Pod has completed its run; Failed: Containers in the Pod have failed to run. |
| Pod IP | IP address of the Pod. |
| CPU (Cores) | Amount of CPU used by the Pod (usage value) and the requested value for CPU (requests.cpu). If available resources on the node are less than the requested value by Pods, Pods cannot start properly. |
| Memory (GiB) | Amount of memory used by the Pod (usage value) and the requested value for memory (requests.memory). If available resources on the node are less than the requested value by Pods, Pods cannot start properly. |
| Restart Count | Number of restarts by the Pod in the last 5 minutes and total restart count since Pod creation. |
Table: Controller Manager Monitoring Trend Statistics
| Parameter | Description |
|---|---|
| CPU Usage | CPU usage of Pods running the component within a specified time range. Hovering over the line chart will display CPU usage values of each Pod at specific time points. |
| Memory Usage | Memory usage of Pods running the component within a specified time range. Hovering over the line chart will display memory usage values of each Pod at specific time points. |
| Average Queuing Delay (ms) | Average delay time for resources in the queue waiting to be processed within a specified time range. Hovering over the line chart will display average delay times of the top 15 resources at specific time points, with legends arranged in descending order of delay time; when there are less than 15 resources, only resources with statistical data will be displayed. |
| Average Processing Delay (ms) | Average delay time before resources are processed within a specified time range. Hovering over the line chart will display average delay times of the top 15 resources at specific time points, with legends arranged in descending order of delay time; when there are less than 15 resources, only resources with statistical data will be displayed. |
| Resource Addition Rate (per minute) | Rate at which resources are added within a specified time range. |
| Queue Depth (count) | Number of I/O requests waiting for service in the queue within a specified time range. |
Scheduler
Scheduler
Scheduler Monitoring Overview
Table: Scheduler Monitoring Overview
| Parameter | Description |
|---|---|
| Total CPU Usage | The total CPU usage by Pods running the component. |
| Total Memory Usage | The total memory usage by Pods running the component. |
| Total Restarts in the Last 5 Minutes | The total number of restarts by Pods running the component in the last 5 minutes. : Restart count = 0;: 1 <= Restart count <= 3;: Restart count > 3. |
| Total Schedules in the Last 5 Minutes | The total number of successful schedules by the component in the last 5 minutes. |
Table: Scheduler Pods List
| Parameter | Description |
|---|---|
| Pod Name | The name of the Pod. |
| Pod Status | The status of the Pod. Running: All containers in the Pod are in a normal running state. Pending: Some containers in the Pod are not in a running state. Completed: The Pod has finished running; Failed: Some containers in the Pod have failed to run. |
| Pod IP | The IP address of the Pod. |
| CPU (Cores) | The amount of CPU used by the Pod (usage value) and the requested value for CPU (requests.cpu). If the available resources on the node are less than the requested value of Pods, the Pods cannot start normally. |
| Memory (Gi) | The amount of memory used by the Pod (usage value) and the requested value for memory (requests.memory). If the available resources on the node are less than the requested value of Pods, the Pods cannot start normally. |
| Restart Count | The number of times the Pod has restarted in the last 5 minutes and the total restart count since Pod creation. |
| Schedule Count | The number of times the Pod has been scheduled in the last 5 minutes. |
Table: Scheduler Monitoring Trend Statistics
| Parameter | Description |
|---|---|
| CPU Usage | The CPU usage of Pods running the component within a specified time range. Moving the cursor over the line chart will display the CPU usage values of each Pod at specific time points. |
| Memory Usage | The memory usage of Pods running the component within a specified time range. Moving the cursor over the line chart will display the memory usage values of each Pod at specific time points. |
| Scheduling Delay (ms) | The average delay time for Pods queued in the queue before being scheduled within a specified time range, based on TP99, TP90, and TP50 performance metrics. Moving the cursor over the line chart will display TP99, TP90, and TP50 data of delay time in the last 5 minutes at specific time points. TP99: The minimum time required for 99% of network requests to be satisfied; TP90: The minimum time required for 90% of network requests to be satisfied; TP50: The minimum time required for 50% of network requests to be satisfied. |
| Scheduling Rate (per minute) | Statistics on the total number of successful and failed schedules within a specified time range. Moving the cursor over the line chart will display the total number of successful and failed schedules in the last minute at specific time points. |
ETCD
ETCD Basic Monitoring
Table: ETCD Monitoring Overview
| Parameter | Description |
|---|---|
| Total CPU Usage | The total CPU usage by Pods running the component. |
| Total Memory Usage | The total memory usage by Pods running the component. |
| Total Restarts in the Last 5 Minutes | The total number of restarts by Pods running the component in the last 5 minutes. : Restart count = 0;: 1 <= Restart count <= 3;: Restart count > 3. |
| Total Leader Changes in the Last Day | The total number of leader changes by Pods running the component in the last day. Note: Frequent leader changes significantly affect ETCD performance. Unstable leaders may be due to network connection issues or high ETCD cluster load. |
ETCD
ETCD Pods List
| Parameter | Description |
|---|---|
| Pod Name | The name of the Pod. |
| Pod Status | The status of the Pod. Running: All containers in the Pod are in a normal running state. Pending: Some containers in the Pod are not in a running state. Completed: The Pod has finished running; Failed: Some containers in the Pod have failed to run. |
| Pod IP | The IP address of the Pod. |
| ETCD Status | The status of the node where ETCD Pods are located. Leader: The node where Pods are located is the Leader, elected by the Raft consensus protocol. Without a Leader, the cluster will not allow any data update operations. After the election, the cluster will maintain the Leader’s position through heartbeat, and if the Leader fails, a new Follower will compete for leadership; Follower: Nodes where the Leader election was unsuccessful are Followers. |
| CPU (Cores) | The total amount of CPU used by Pods running ETCD and the requested value for CPU (requests.cpu). Pods cannot start normally if the available resources on the node are less than the requested value of Pods. |
| Memory (Gi) | The total amount of memory used by Pods running ETCD and the requested value for memory (requests.memory). Pods cannot start normally if the available resources on the node are less than the requested value of Pods. |
| Restart Count | The number of times Pods have restarted in the last 5 minutes and the total restart count since Pod creation. |
ETCD Monitoring Trend Statistics
| Parameter | Description |
|---|---|
| CPU Usage | The CPU usage of Pods running ETCD within a specified time range. Hovering over the line chart will display the CPU usage values of each Pod at specific time points. |
| Memory Usage | The memory usage of Pods running ETCD within a specified time range. Hovering over the line chart will display the memory usage values of each Pod at specific time points. |
| Database Size | The database size of Pods within a specified time range. Hovering over the line chart will display the database size of each Pod at specific time points, e.g., Database Size 88.88 Mi at 192.168.16.53:2379. |
| Resource Count | Top 10 resource counts grouped by type within a specified time range. Hovering over the line chart will display the count of top 15 resource types at specific time points; if there are fewer than 15 resource types, only resources with statistical data will be displayed. |
| Client Network Traffic Receive Rate | The network traffic receive rate of each Pod within a specified time range. Hovering over the line chart will display the average network traffic receive rate of each Pod in the last 5 minutes at specific time points. |
| Client Network Traffic Send Rate | The network traffic send rate of each Pod within a specified time range. Hovering over the line chart will display the average network traffic send rate of each Pod in the last 5 minutes at specific time points. |
| WAL Sync Time | The delay of WAL (Write-ahead logging) fsync calls for each Pod within a specified time range. Hovering over the line chart will display TP99, TP90, TP50 data of sync time in the last 5 minutes at specific time points. |
| Backend Commit Time | The distribution of commit delay for backend calls within a specified time range. Hovering over the line chart will display TP99, TP90, TP50 data of commit time in the last 5 minutes at specific time points. |
| RPC Rate | The successful and failed rate of RPC flow messages from server within a specified time range. Hovering over the line chart will display success and failure rates at specific time points. |
| Raft Proposal Rate | The rate of proposals submitted by Raft within a specified time range. Records the rate of negotiated consensus proposals submitted. If the cluster is running well, this metric should increase over time. Hovering over the line chart will display submission, queuing, application, and failure rates in… |
ETCD Status
Table: ETCD Status
| Parameter | Description |
|---|---|
| etcd leader | The synchronous node in the etcd cluster responsible for coordinating and managing work. |
| etcd read/write bytes | The amount of read and write data in etcd. |
| etcd iops | The number of read and write operations per second in etcd, where IOPS stands for Input/Output Operations Per Second. |
| etcd io latency | The read and write latency of etcd, indicating the time required for etcd to respond to read and write requests. |
| is leader | Whether the monitored node is elected as the Leader node in the etcd cluster. |
| has leader | Whether the etcd cluster has a valid Leader node. |
| leader seen leader | The number of times the Leader node has switched. |
| apiserver request | The number of requests to the apiserver. |
| fsync | The time taken by etcd to call fsync, used to ensure that committed data is persistently saved to disk. |
| db size | The size of disk space occupied by the etcd cluster. db_total indicates the total capacity of the database; db_in_use indicates the actual database size currently used by the etcd cluster, which changes as data is written and updated in the cluster. |
| etcd-top-size-key | The key in the etcd database that occupies the most storage space and its size. |
| etcd top version key | The key in the etcd database with the most versions. |
| etcd top change size | The key in the etcd database with the largest change in storage space. |
| etcd top change | The key in the etcd database with the most changes. |
OS-Level CPU/Memory/IO Status
Table: OS-Level CPU/Memory/IO Status
| Parameter | Description |
|---|---|
| host iops | IOPS situation of disks on the host node. |
| host io time | Read/write time of disks on the host node. |
| top-cpu | Pod on the host node with the highest CPU usage. |
| top-mem | Pod on the host node with the highest memory usage. |
| host cpu | CPU usage of the host node. |
| host io bandwidth | Disk read/write bandwidth of the host node. |
| host mem | Memory usage of the host node. |
Process-Level IO Status
Table: Process-Level IO Status
| Parameter | Description |
|---|---|
| bio done read call total | Total number of blockio read operations in the etcd cluster. |
| bio done write call total | Total number of blockio write operations in the etcd cluster. |
| bio done read bytes total | Total number of bytes read in blockio operations in the etcd cluster. |
| bio done write bytes total | Total number of bytes written in blockio operations in the etcd cluster. |
| bio done read latency total | Total response time of read operations in blockio in the etcd cluster. |
| bio done write latency total | Total response time of write operations in blockio in the etcd cluster. |
Collector Status
Table: Collector Status
| Parameter | Description |
|---|---|
| CPU Usage | CPU usage of the collector. |
| Memory Usage | Memory usage of the collector. |