Queries
In the log query and analysis panel of the operations center, you can view the standard output (stdout) logs within the permissions of the login account, including system logs, product logs, Kubernetes logs, and application logs. By analyzing the logs, you can understand the running status of the resources.
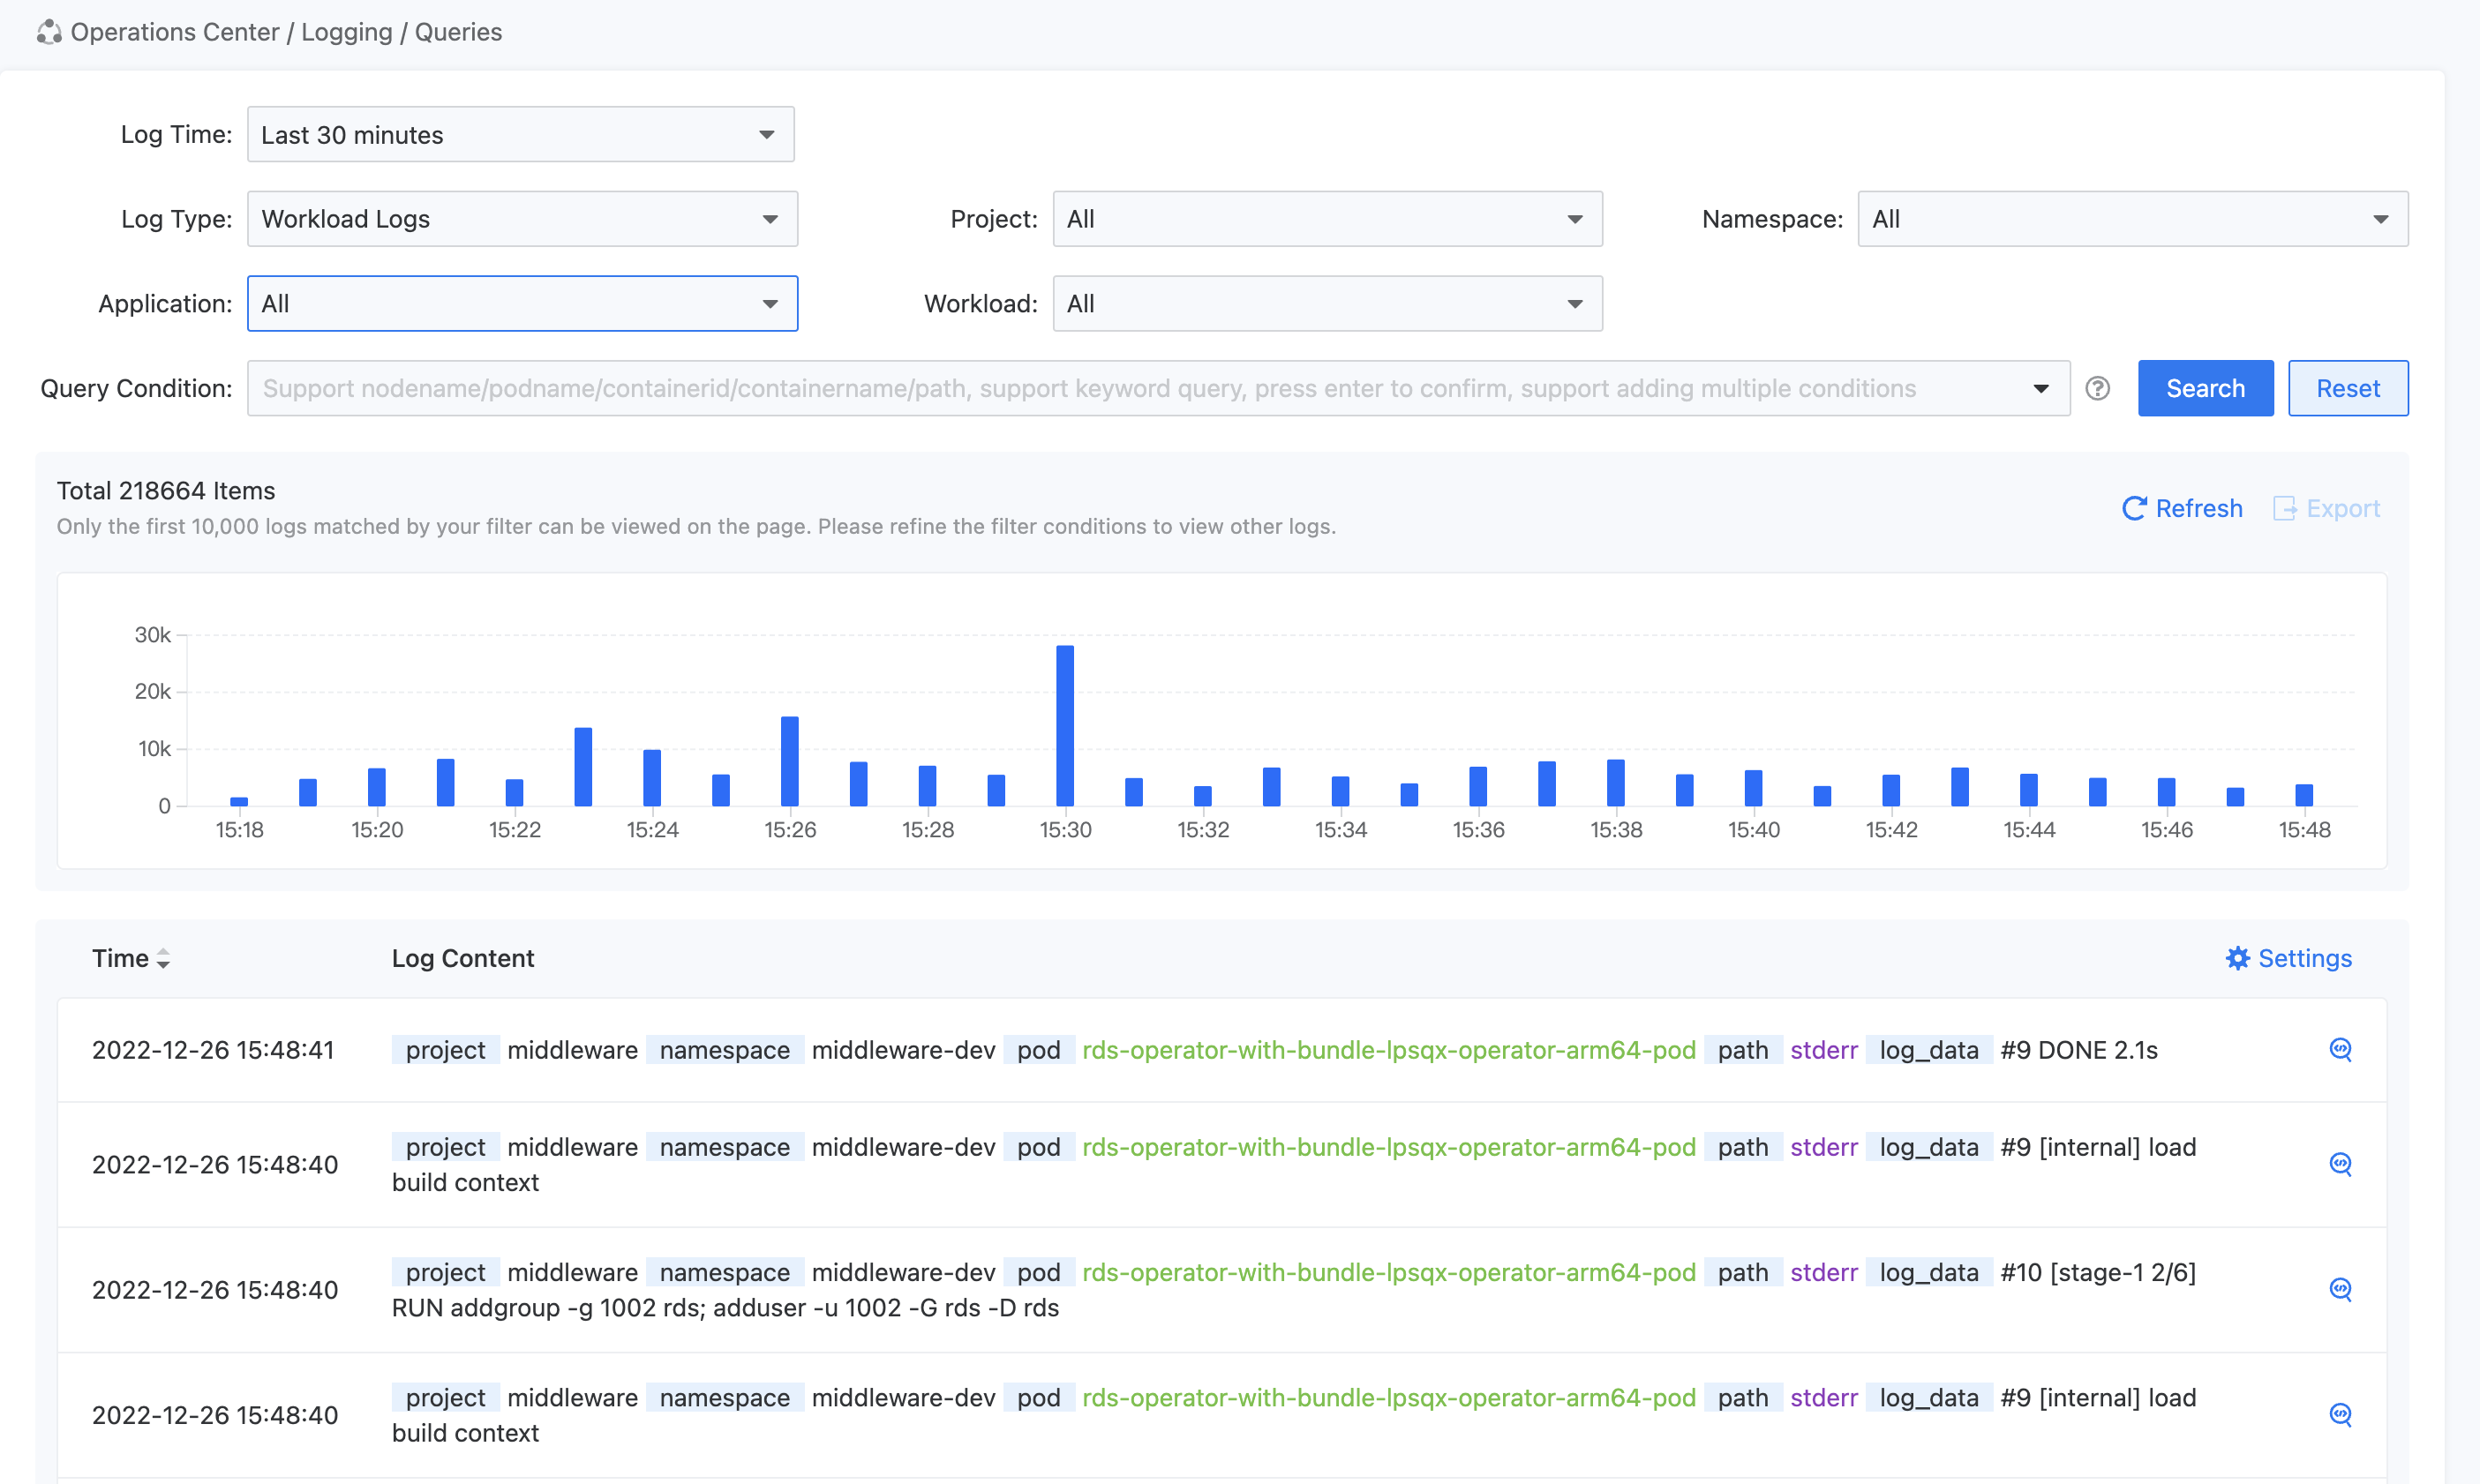
Support filtering logs by query conditions to select or customize the specified time range, and display the log query results through bar charts and standard output.
Tip: For performance reasons, the platform can display a maximum of 10,000 logs at a time. If the log volume on the platform is too large within a certain period of time, please narrow down the time range of the log query and query the logs in stages.
The platform will collect and store system logs, product logs, Kubernetes logs, and custom application logs. Platform management personnel or operators can manage log retention policies, view categorized logs, and export logs through the log function module.
-
System Logs: Logs on the host node, such as dmesg, syslog/messages, secure, etc.
-
Product Logs: The logs of the platform’s own components as well as third-party components integrated into the platform, such as Container-Platform, Platform-Center, DevOps, Service-Mesh, etc.
-
Kubernetes Logs: The logs of Kubernetes container orchestration-related components, as well as the logs generated by kubelet, kubeproxy, and docker, such as docker, kube-apiserver, kube-controller-manager, etcd, etc.
-
Custom application logs: Logs generated by custom applications or services.
Prerequisites
Deploy Log Agent for the cluster.
Procedure of operation
-
In the left navigation bar, click Operations center > Logging > Queries.
-
After setting the filtering conditions (project, cluster, namespace) and query conditions, click Search.
Note:
-
The Kubernetes (K8s) infrastructure is a container orchestration platform that automates the deployment, scaling, and management of containerized applications.
-
Cloud-native refers to the design and architecture principles that enable applications to fully leverage the capabilities of cloud computing platforms. It involves building applications as a collection of loosely coupled microservices that can be deployed and scaled independently.
-
The K8s ecosystem includes various components and tools that enhance the functionality and manageability of the platform. These include container runtimes, networking solutions, storage systems, monitoring tools, and more.
-
K8s provides a declarative approach to application deployment and management. Users define the desired state of their applications using YAML or JSON files, and K8s ensures that the actual state matches the desired state.
-
K8s supports horizontal scaling of applications by automatically creating and managing multiple instances of a containerized application based on resource utilization.
-
K8s provides built-in mechanisms for service discovery and load balancing, allowing applications to easily communicate with each other and distribute traffic across multiple instances.
-
K8s supports rolling updates and rollbacks, allowing users to seamlessly update or revert to previous versions of their applications without downtime.
-
K8s provides built-in mechanisms for self-healing, automatically restarting failed containers and replacing unhealthy instances to ensure high availability of applications.
-
K8s supports multi-tenancy, allowing multiple users or teams to share the same cluster while maintaining isolation and resource allocation.
-
K8s is highly extensible and customizable, with a rich ecosystem of plugins and extensions that can be used to enhance its functionality and integrate with other tools and platforms.
-
K8s is platform-agnostic and can run on various cloud providers, on-premises data centers, and even bare-metal servers.
-
K8s is widely adopted in the industry and has become the de facto standard for container orchestration and cloud-native application deployment. It is supported by a large and active community of developers and contributors.
-
Log Types: Different log types have different available log filtering and querying conditions.
-
Support selecting or inputting multiple query condition tags. The query conditions between different resource types are connected by “and”, and the multiple conditions within the same resource type are connected by “or”. For example, if the query conditions are
podname:pod1,podname:pod2,nodename:a1,search:Keyword, the search result will be the logs of the pods named pod1 and pod2 on node a1, and only the logs containing the keyword Keyword will be queried. -
Only keyword search conditions support fuzzy search.
-
- The bar chart displays the total number of logs within the current query time range and the number of logs at different time intervals. Click on a bar in the chart to view the logs within the time range between this bar and the next one.
Other Operations
Export log data
The page can display up to 10,000 log entries. When there are too many log entries to display, you can use the log export feature to view up to 1 million log entries.
Procedure of operation
-
Click on Export in the upper right corner of the bar chart, and configure the following parameters in the pop-up Export Log dialog box.
-
Scope: The scope of log export, which can be selected as either Current Page or All Results.
Current Page: Export only the query results of the current page, up to a maximum of 1000 records.
All Results: Export all log data that meets the current query conditions, up to a maximum of 1 million records. -
Fields: The display fields of the logs. You can select which field information to display in the exported log file by clicking the checkbox on the right side of the field name.
Note: The optional display fields may vary depending on the log type. Please select the appropriate fields based on your specific requirements.
-
Format: The export format of the log file, supporting the selection of
txtorcsv, and exporting in compressed format using.gzip.
-
-
Click Export, and the browser will directly download the compressed file to your local machine.
View log context
Support viewing the context of a specific log entry.
Procedure of operation
-
Click on the
 icon in the upper right corner of the log content area. In the pop-up dialog box, it will display 5 logs before and after the current log printing time, allowing operators to have a more detailed understanding of the reasons for the current log generation of resources.
Furthermore, click on the Load More button on the context records above and below to query more context information. -
Support setting the display fields of log context or exporting log context. When exporting log context, there is no need to select a scope. After clicking the Export button, the log context file will be directly downloaded to the local machine through the browser.