Events
The platform integrates with Kubernetes events, records important status changes of Kubernetes resources, and various event changes in running states, and provides storage, querying, and visualization capabilities. When there are abnormal situations with clusters, nodes, Pods, and other resources, the specific reasons can be analyzed through event analysis.
And based on event reasons, alert policies can be created for workloads. When the number of critical events reaches the alert threshold, alerts can be automatically triggered and relevant personnel can be notified for timely handling, in order to reduce the operational risks of the platform business.
Procedure of operation
-
In the left navigation bar, click Operations center > Events.
Tip: Switch the cluster to view events for by selecting it from the dropdown menu in the top navigation bar.
Overview of Events
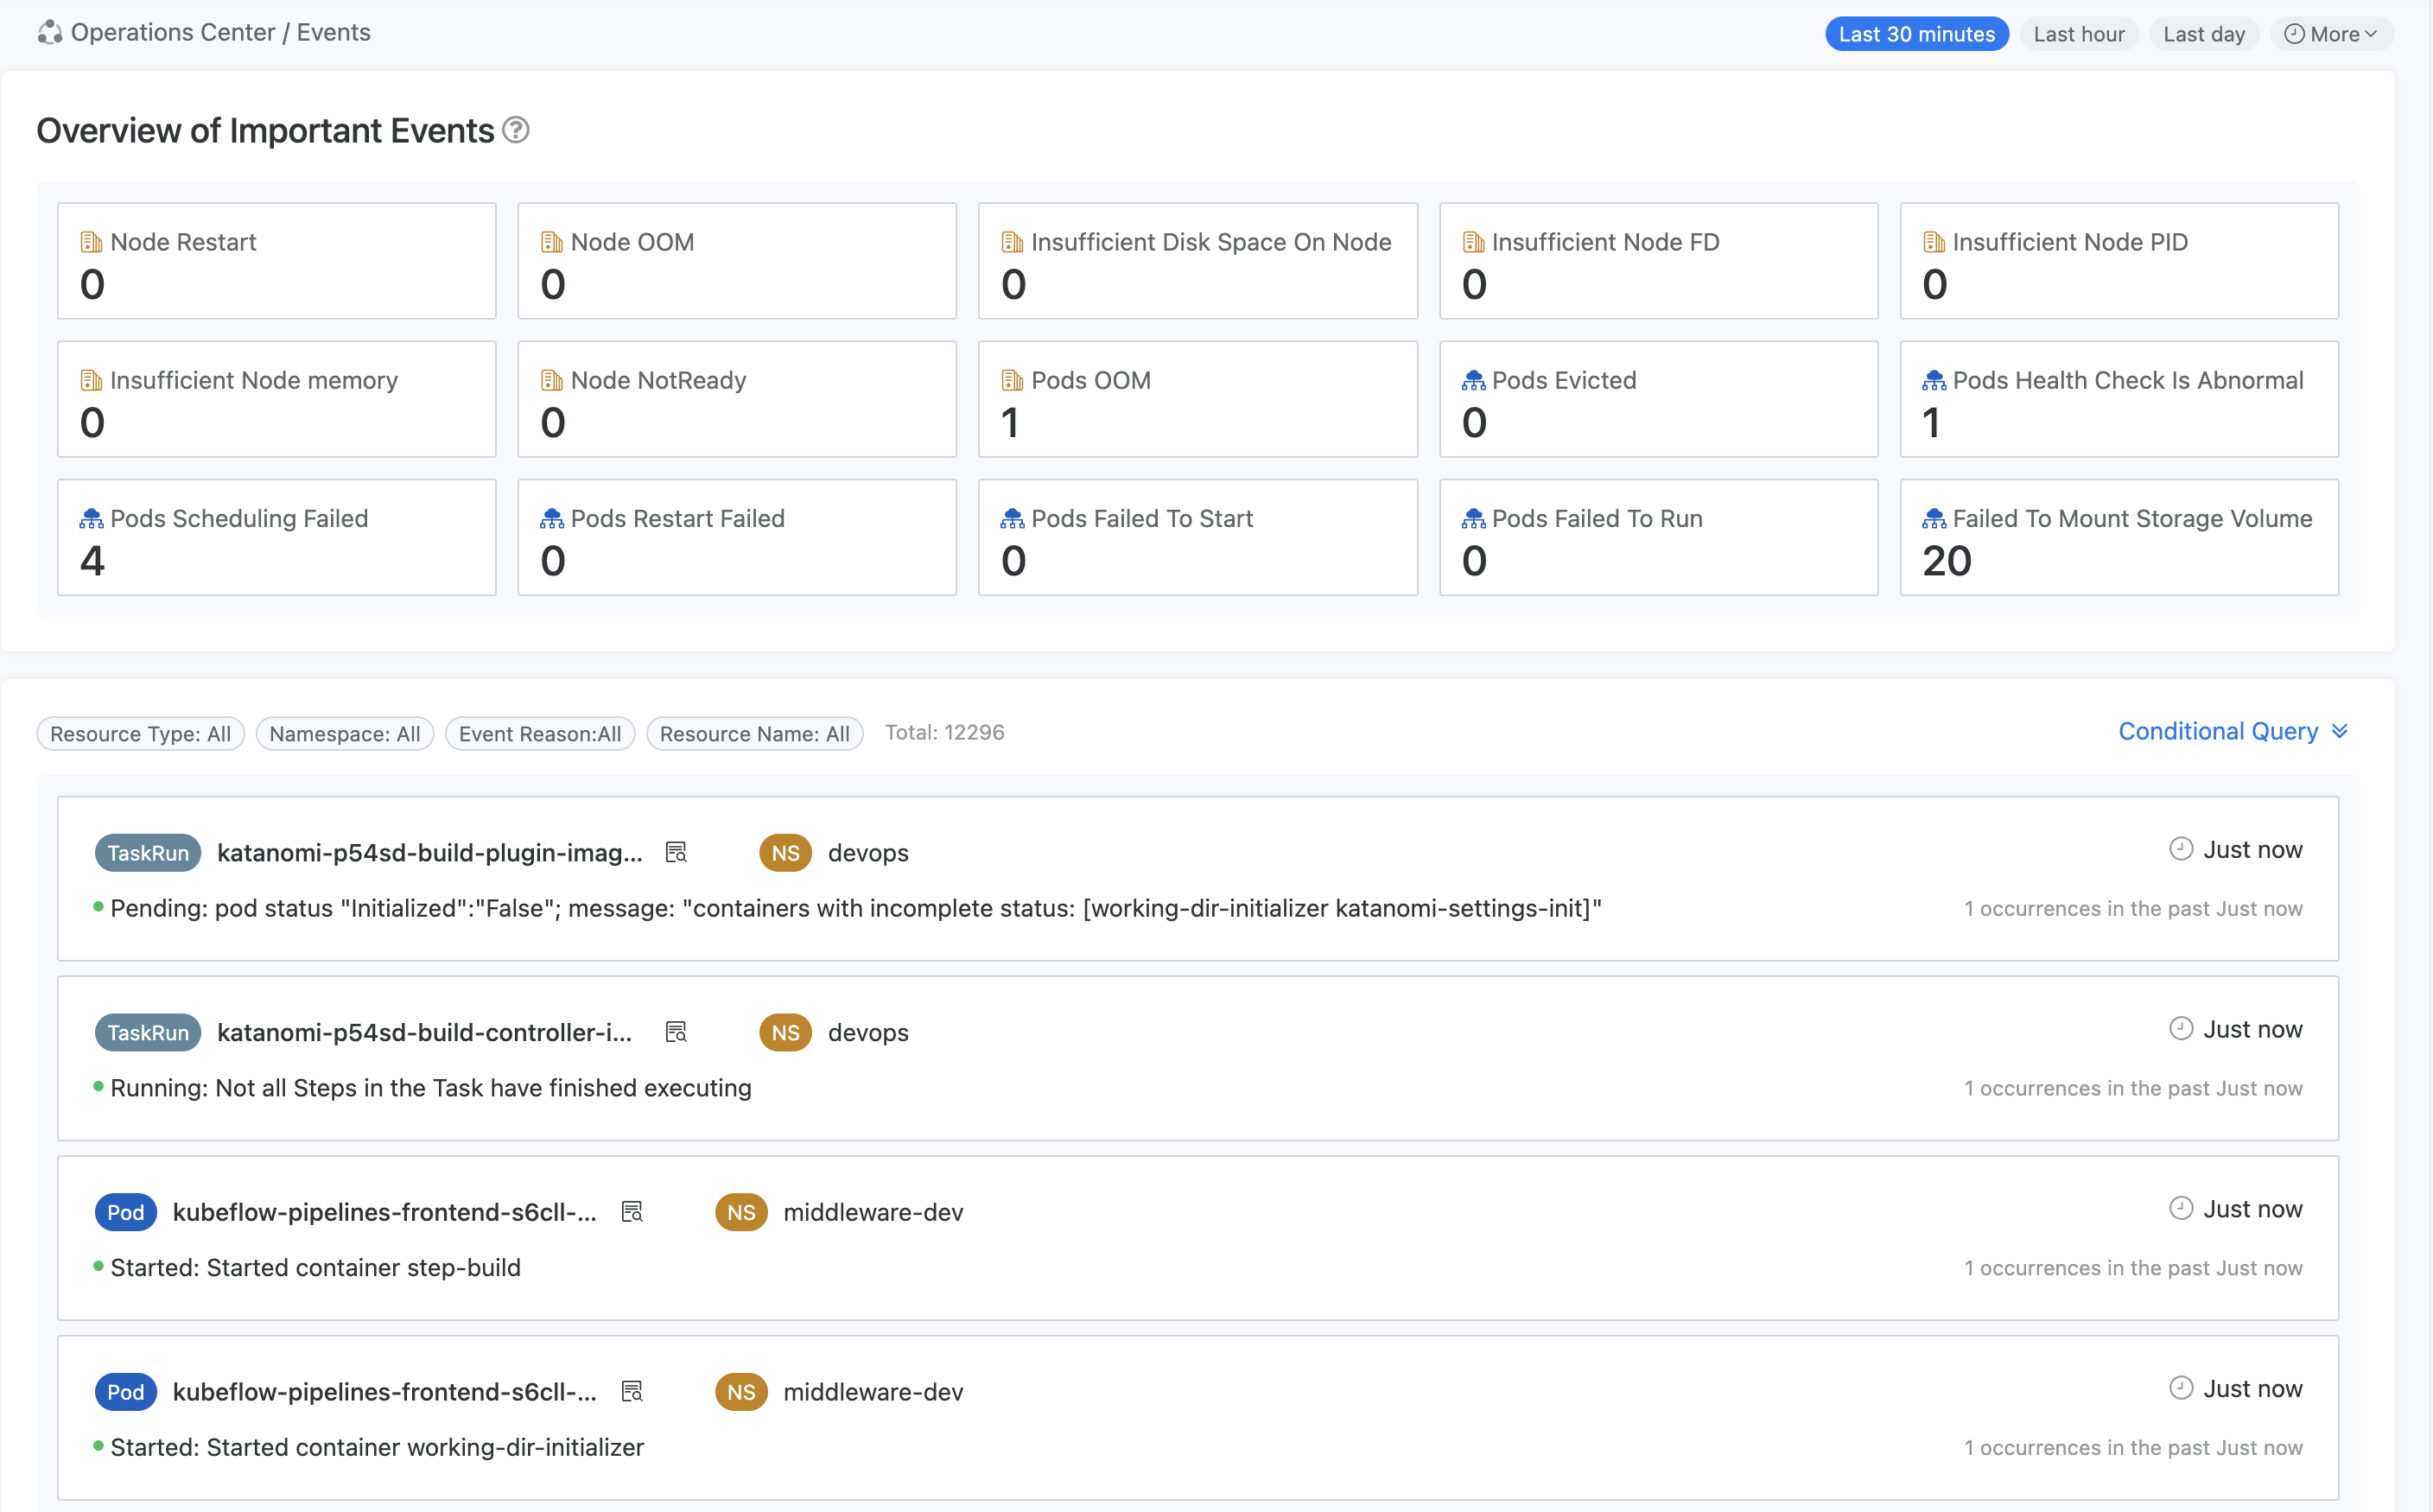
The event page displays an overview of important events and resource event records within the last 30 minutes (can be selected or customized time range) by default.
-
Overview of Important Events: The card displays the reasons for important events and the number of resources that experienced such events within the specified time range.
Note: When the same resource experiences multiple events of the same type, the number of resources will not be accumulated.
For example, if there are 20 resources with node restart events, it means that within the specified time range, 20 resources experienced such events, and the same resource may have experienced multiple events. -
Resource Event Records: Located below the important events overview area, it displays all event records that meet the query criteria within the specified time range.
You can filter events of specific types by clicking on the corresponding event card, or expand and enter query criteria for searching.
The query criteria are explained as follows:-
Resource Type: The type of Kubernetes resource where the event occurred, such as Pod.
-
Namespaces: The namespace in which the Kubernetes resource that triggered the event resides.
-
Event Reason: The reason for the occurrence of the event.
-
Event level: the level of importance of the event, such as Warning.
-
Resource name: the name of the Kubernetes resource where the event occurred. Multiple names can be selected or entered.
-
Hints:
-
Click on the query log in the
 to view the details of the event in the pop-up Event Details dialog box.
 -
The color of the icon to the left of the event cause indicates the event level. The green icon indicates that the event is
Normaland can be ignored; the orange icon indicates that the event isWarningand there is a resource abnormality, so you need to pay attention to this event to avoid causing a failure.