Architecture
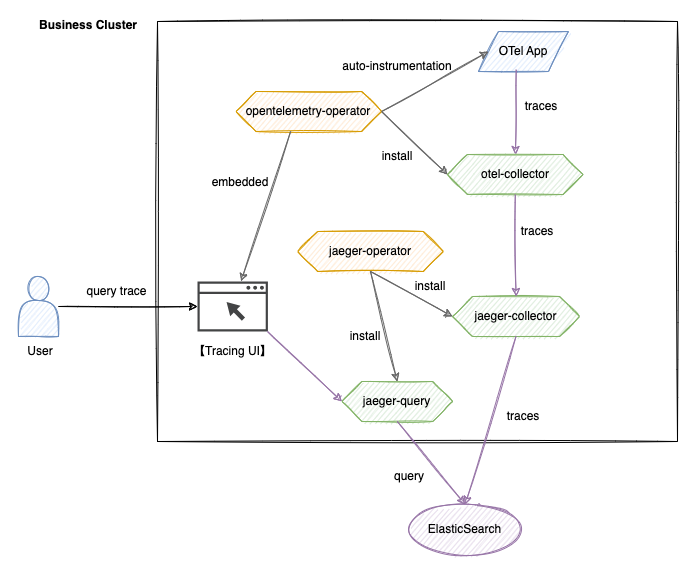
This architecture is built on the OpenTelemetry and Jaeger technology stack, achieving the full lifecycle management of distributed tracing. The system comprises five core modules: data collection, transmission, storage, querying, and visualization.
Core Components
-
OpenTelemetry System
- opentelemetry-operator
A cluster-level Operator responsible for deploying and managing the otel-collector component, providing OTel automatic injection capability. - otel-collector
Receives tracing data from applications, filters and batches it, and then forwards it to the jaeger-collector. - Tracing UI
A self-developed visualization interface that integrates with the jaeger-query API, supporting multi-dimensional query conditions.
- opentelemetry-operator
-
Jaeger System
- jaeger-operator
Deploys and manages the jaeger-collector and jaeger-query components. - jaeger-collector
Receives tracing data forwarded and processed by the otel-collector, performs format conversion, and writes it to Elasticsearch. - jaeger-query
Provides a tracing query API, supporting multi-condition retrieval including TraceID and labels.
- jaeger-operator
-
Storage Layer
- Elasticsearch
A distributed storage engine that supports efficient writing and retrieval of massive Span data.
- Elasticsearch
Data Flow
-
Writing Process
Application -> otel-collector -> jaeger-collector -> ElasticsearchThe application generates Span data via SDK or automatic injection, which is standardized by the otel-collector and subsequently persisted to Elasticsearch by the jaeger-collector.
-
Query Process
User -> Tracing UI -> jaeger-query -> ElasticsearchThe user submits query conditions through the UI, and jaeger-query retrieves data from Elasticsearch; the UI visualizes the results based on the return data.