DeepFlow User Guide
DeepFlow provides Grafana dashboards for visualizing network and application performance metrics, as well as automatic tracing capabilities for applications using eBPF technology. To access the DeepFlow Grafana dashboards, you need to install the DeepFlow plugin from the Marketplace. After installation, you can access the Grafana web UI through the Ingress configured during installation. Login credentials are required to access the Grafana web UI.
For more information about using Grafana dashboards, refer to the Grafana documentation.
TOC
LoginUse DashboardsDeepFlow SystemDeepFlow TemplatesDistributed TracingUser CasesAdditional resourcesLogin
To log in to the Grafana web UI, you need the following information which is configured during the installation of the DeepFlow plugin:
- Username: The username for the Grafana web console.
- Password: The password for the Grafana web console.
After the first login, it is strongly recommended to change the password for security reasons.
Use Dashboards
Navigate to the Dashboards section in the Grafana web UI to access various pre-configured dashboards provided by DeepFlow. Dashboards are placed in two folders: DeepFlow System and DeepFlow Template.
- DeepFlow System: This folder contains system-level dashboards that provide insights into the overall health and performance of the DeepFlow system.
- DeepFlow Templates: This folder contains application-level dashboards that can be customized based on specific application requirements.
DeepFlow System
This folder contains a dashboard named DeepFlow Agent, which provides insights into the status and performance of nodes where DeepFlow agents are deployed.
As to network observability, it includes metrics such as:
CAUTION: The panels marked with 🔥 indicate potential issues that may require attention.
DeepFlow Templates
This folder contains various dashboards including network/L4 metrics, application/L7 metrics, and automatic tracing dashboards.
Here are dashboards related to network observability:
In summary, DeepFlow offers a comprehensive set of dashboards for monitoring and analyzing network and application performance in both Kubernetes Pods and host networks.
- Dashboards with a prefix Network provide L4-level metrics, while those with a prefix Application offer L7-level insights.
- Dashboards with a suffix Cloud or containing Cloud Host in their names focus on host networks, while those with a suffix K8s or without suffix Cloud focus on Kubernetes Pods.
- Dashboards with a suffix Map visualize the topology of network or application components.
- Dashboards containing Log in their names display detailed logs for network flows or application requests.
- Dashboards with Monitoring in their names focus on specific protocols or services, such as DNS, SQL, Redis, and Dubbo.
- Distributed Tracing dashboards provide automatic tracing capabilities for applications requests.
Distributed Tracing
DeepFlow's Distributed Tracing feature allows you to trace requests as they propagate through various services and components in your applications. This helps you identify performance bottlenecks, understand service interactions, and optimize application performance.
Panels
In the Distributed Tracing dashboards, you can view detailed information about each request, including:
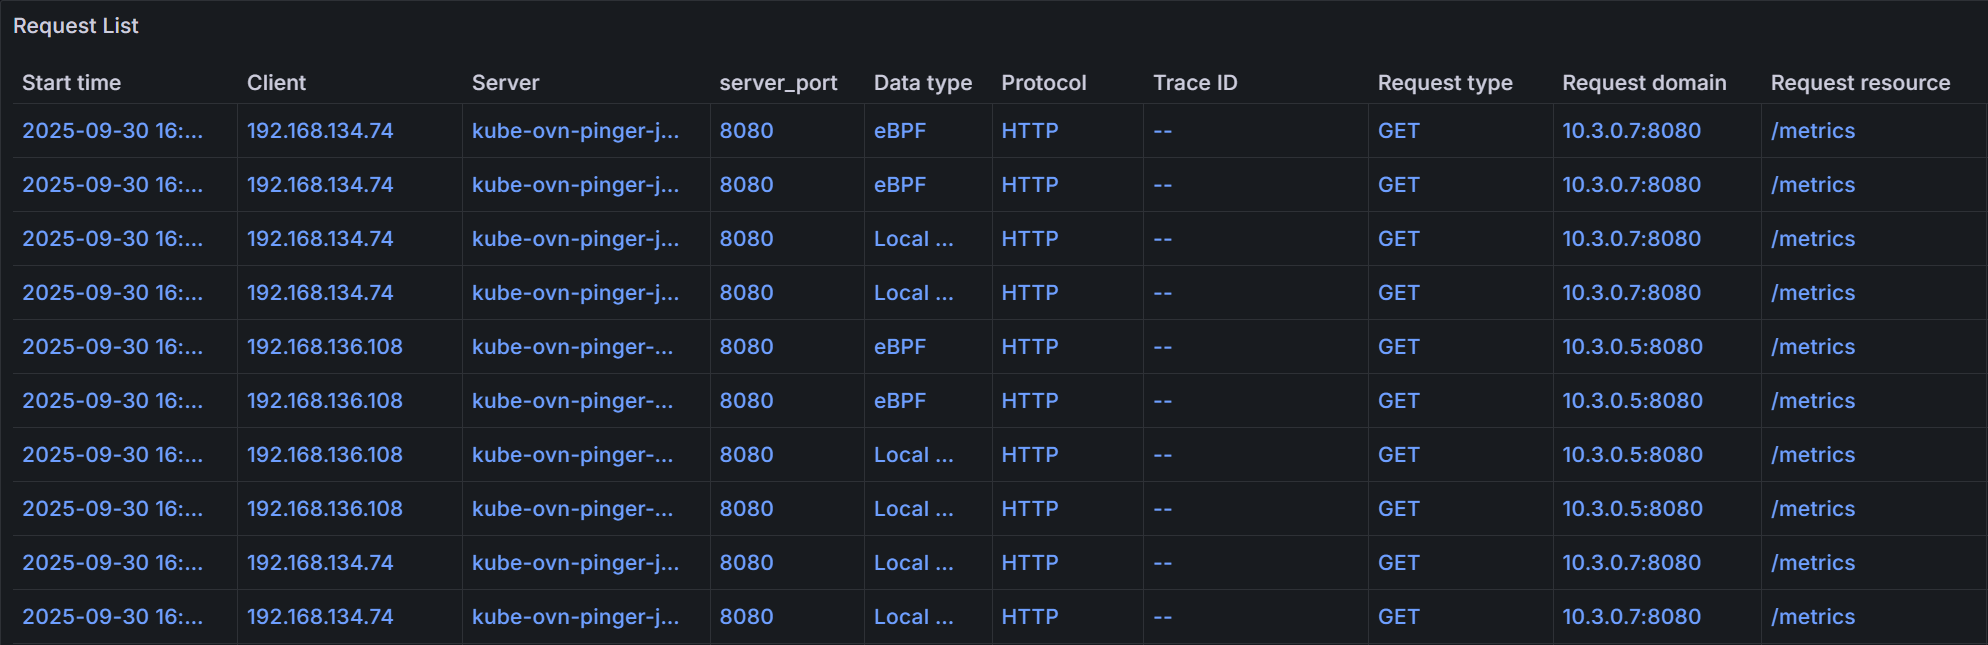
- Request List: A list of all traced requests, including their IDs, timestamps, durations, and statuses.
- Flame Graph: A visual representation of the call stack for each request, showing the time spent in each service or component.
You can filter and search for specific requests based on various criteria, such as namespace, workload, trace ID, span ID, request resource, and time range. Here is an example of a request list:
Click on a specific request to view its detailed trace information in the Flame Graph:
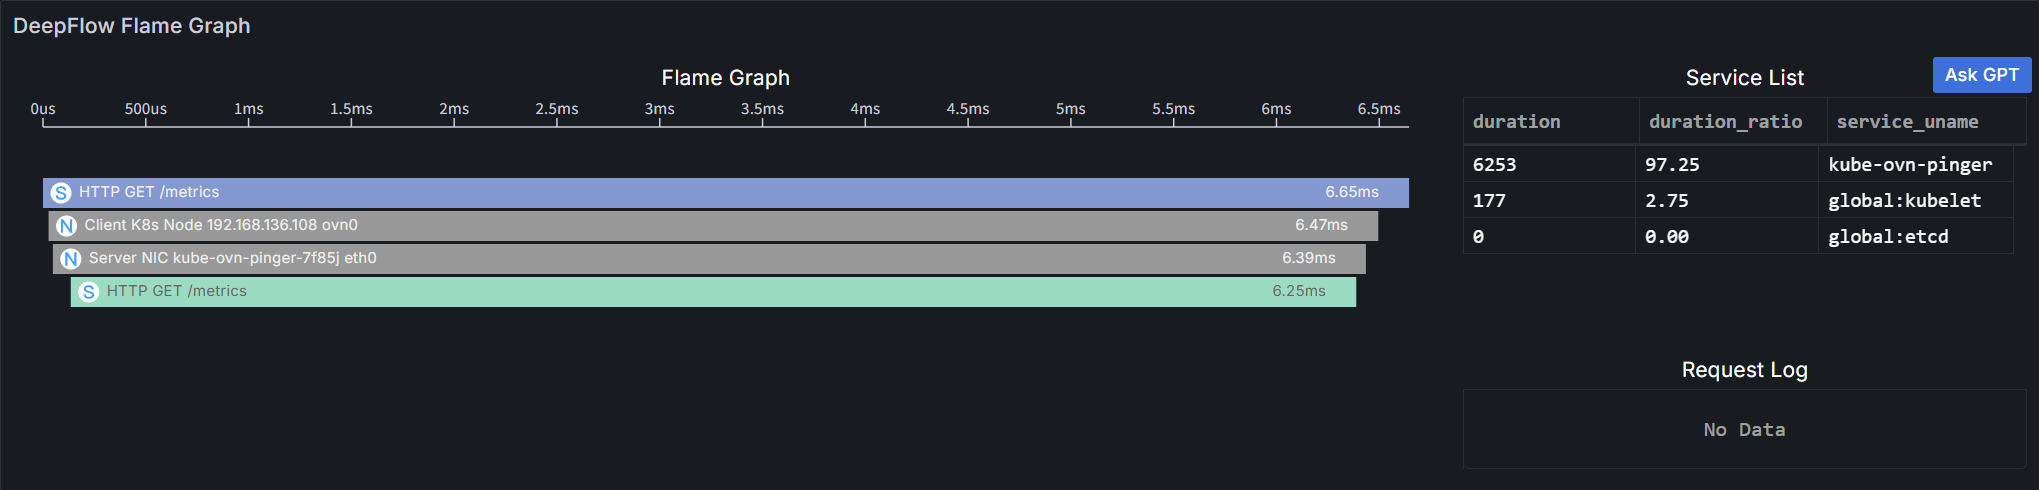
A flame graph consists of multiple bar-shaped blocks, each representing a span. The x-axis represents time, and the y-axis represents call stack depth. Spans are displayed from top to bottom in the order they are called.
Details are as follows:
- Length: Along the x-axis, represents the execution time of a span, with each end corresponding to the start and end times.
- Service List: Shows the proportion of latency consumed by each service. Clicking a service will highlight the corresponding spans in the flame graph.
- Color: Application spans and system spans use a unique color for each service; all network spans are gray (as they do not belong to any service).
- Display Information: Each bar's display information consists of an icon, call information and execution time.
- Icon: Differentiates span types:
- A Application span, collected via the OpenTelemetry protocol, covering business code and framework code.
- S System span, collected via eBPF with zero intrusion, covering system calls, application functions (e.g., HTTPS), API Gateway, and service mesh Sidecar.
- N Network span, collected from network traffic via BPF, covering container network components such as iptables, ipvs, OvS, and LinuxBridge.
- Call Information: Varies by span type:
- Application Span and System Span: Application protocol, request type, and request resource.
- Network Span: Observation point.
- Execution Time: Total time consumed from span start to end.
- Icon: Differentiates span types:
- Operations: Supports hover and click.
- Hover: Displays call information, instance information and execution time in a tooltip.
- Instance Information: Varies by span type:
- Application Span: Service and resource instance.
- System Span: Process and resource instance.
- Network Span: Network interface and resource instance.
- Execution Time: The total execution time of the span and its proportion of self-execution time.
- Instance Information: Varies by span type:
- Click: Highlights the span and its parent span, and allows viewing detailed information of the clicked span.
- Hover: Displays call information, instance information and execution time in a tooltip.
Configuration
DeepFlow supports parsing unique Request IDs injected by applications (e.g., almost all gateways inject X-Request-ID) and associating different requests with the same Request ID into a single trace. To add your Request ID header for parsing, you can modify the DeepFlow agent group configuration while installing or updating the DeepFlow plugin.
The configuration item is processors.request_log.tag_extraction.tracing_tag.x_request_id, which accepts a list of header names.
Here is an example configuration snippet:
For more details on configuring the DeepFlow agent, refer to the DeepFlow Agent Configuration documentation.
User Cases
- Network Performance Monitoring: Use the Network/L4 dashboards to monitor bandwidth, packet loss, and TCP performance across your cluster hosts and Kubernetes Pods. Identify bottlenecks and optimize network configurations.
- Application Performance Monitoring: Use the Application/L7 dashboards to monitor request rates, error rates, and latency for various applications running in your cluster. Identify slow endpoints and optimize application performance.
- Topology Visualization: Use the Map dashboards to visualize the network and application topology, helping you understand the relationships and dependencies between different components.
- Log Analysis: Use the Log dashboards to analyze detailed flow logs and request logs, helping you troubleshoot issues and gain insights into traffic patterns.
- Protocol Monitoring: Use the Monitoring dashboards to monitor specific protocols and services, such as DNS queries, SQL database performance, Redis commands, and Dubbo RPC calls.
- Distributed Tracing: Use the Distributed Tracing dashboards to trace requests as they propagate through various services and components, helping you identify performance bottlenecks and optimize service interactions.