Network Observability
TOC
About DeepFlowWhat is DeepFlowUsing eBPF TechnologySoftware ArchitectureInstall DeepFlowIntroductionKernel RequirementsDeployment TopologyPreparationStorage ClassPackageInstallAccess the Grafana web UIAdditional resourcesAbout DeepFlow
What is DeepFlow
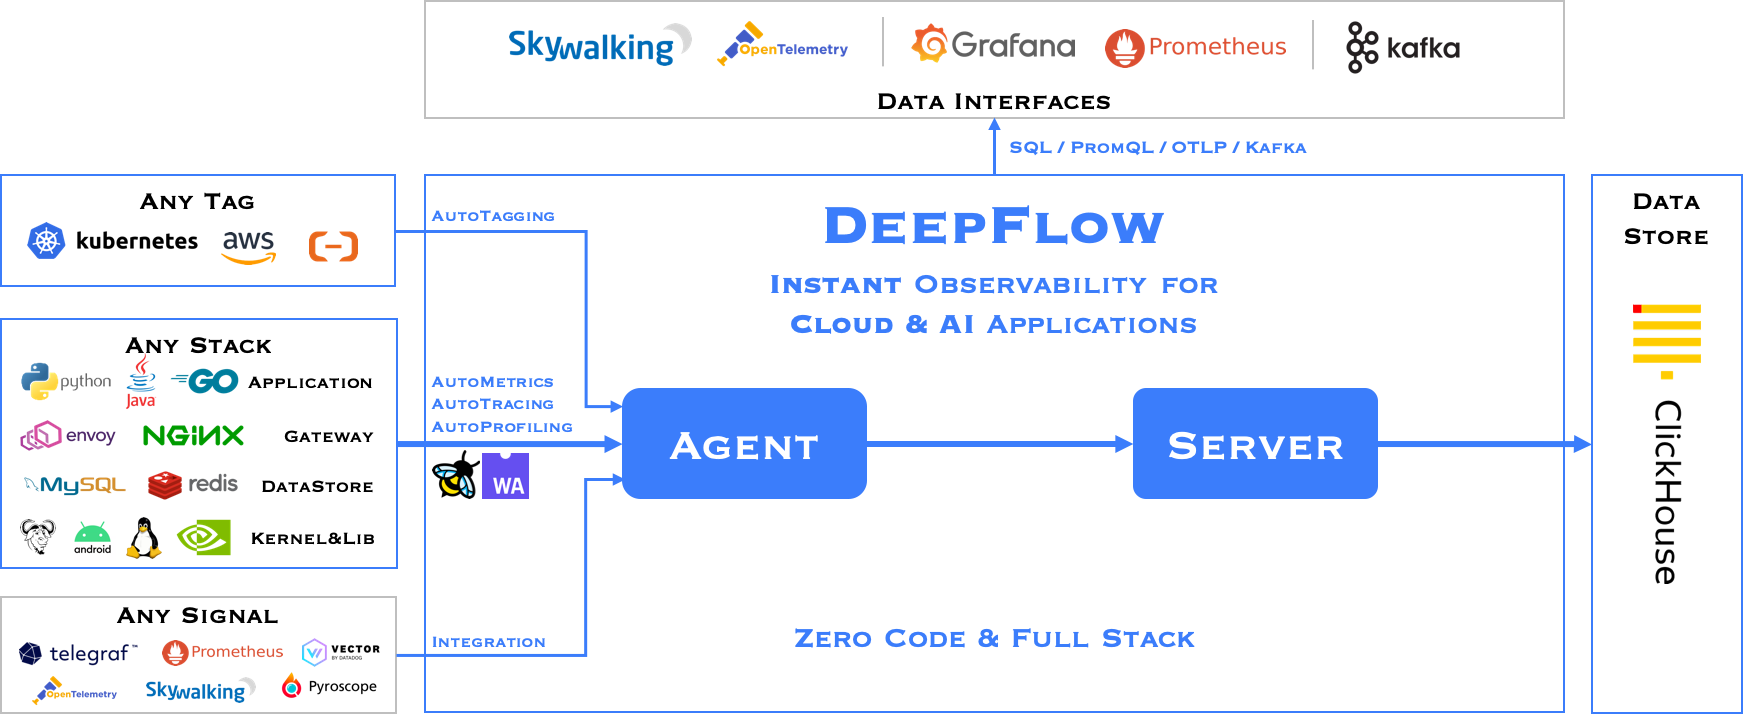
The DeepFlow open-source project aims to provide deep observability for complex cloud-native and AI applications. DeepFlow implemented Zero Code data collection with eBPF for metrics, distributed tracing, request logs and function profiling, and is further integrated with SmartEncoding to achieve Full Stack correlation and efficient access to all observability data. With DeepFlow, cloud-native and AI applications automatically gain deep observability, removing the heavy burden of developers continually instrumenting code and providing monitoring and diagnostic capabilities covering everything from code to infrastructure for DevOps/SRE teams.
Using eBPF Technology
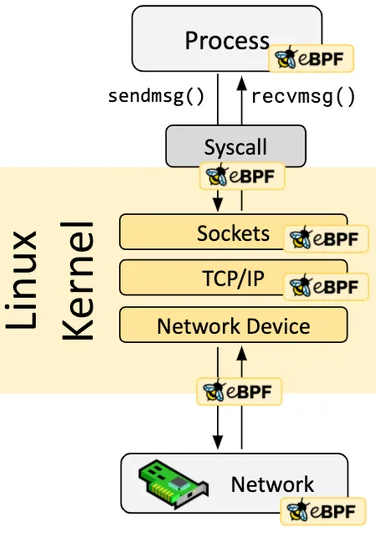
Assuming you have a basic understanding of eBPF, it is a secure and efficient technology for extending kernel functionality by running programs in a sandbox, a revolutionary innovation compared to traditional methods of modifying kernel source code and writing kernel modules. eBPF programs are event-driven, and when the kernel or user programs pass through an eBPF Hook, the corresponding eBPF program loaded at the Hook point will be executed. The Linux kernel predefines a series of commonly used Hook points, and you can also dynamically add custom Hook points in the kernel and applications using kprobe and uprobe technologies. Thanks to Just-in-Time (JIT) technology, the execution efficiency of eBPF code can be comparable to native kernel code and kernel modules. Thanks to the Verification mechanism, eBPF code will run safely without causing kernel crashes or entering infinite loops.
Software Architecture
DeepFlow consists of two components, Agent and Server. An Agent runs in each K8s node, legacy host and cloud host, and is responsible for AutoMetrics and AutoTracing data collection of all application processes on the host. Server runs in a K8s cluster and provides Agent management, tag injection, data ingest and query services.
Install DeepFlow
Introduction
Kernel Requirements
The eBPF capabilities (AutoTracing, AutoProfiling) in DeepFlow have the following kernel version requirements:
Additional notes on kernel versions:
- CentOS 7.9 and RedHat 7.6 have backported some eBPF capabilities (opens new window)into the 3.10 kernel.
In these two distributions, the detailed kernel versions supported by DeepFlow are as follows (dependent hook points):
- 3.10.0-957.el7.x86_64
- 3.10.0-1062.el7.x86_64
- 3.10.0-1127.el7.x86_64
- 3.10.0-1160.el7.x86_64
- Golang/OpenSSL processes inside containers are not supported.
- In kernel version 4.14, a tracepoint cannot be attached by multiple eBPF programs (e.g., two or more deepflow-agents cannot run simultaneously), this issue does not exist in other versions
RedHat's statement:
The eBPF in Red Hat Enterprise Linux 7.6 is provided as Tech Preview and thus doesn't come with full support and is not suitable for deployment in production. It is provided with the primary goal to gain wider exposure, and potentially move to full support in the future. eBPF in Red Hat Enterprise Linux 7.6 is enabled only for tracing purposes, which allows attaching eBPF programs to probes, tracepoints and perf events.
Deployment Topology

Preparation
Storage Class
MySQL and ClickHouse in DeepFlow require Persistent Volume storage provisioned by Storage Class.
For more information on storage configuration, please refer to the Storage documentation.
Package
Download the DeepFlow package
Visit the Customer Portal to download the DeepFlow package.
If you don't have access to the Customer Portal, contact technical support.
Upload the package to the platform
Use the violet tool to publish the package to the platform.
For detailed instructions on using this tool, refer to the CLI.
Install
-
Navigate to Administrator > Marketplace > Cluster Plugins.
-
Search for "Alauda Container Platform Observability with DeepFlow" in the plugin list.
-
Click Install to open the installation configuration page.
-
Fill in the configuration parameters as needed. For detailed explanations of each parameter, refer to the table below.
-
Wait for the plugin state to be Installed.
Table: Configuration Parameters
Access the Grafana web UI
You can access the Grafana web UI via the hosts and serving path specified in the Ingress configuration, and login with the username and password.
It's highly recommended to change the password after the first login.