logo
Alauda Container Platform
English
简体中文
English
简体中文
logo
Alauda Container Platform
Navigation

Overview

Architecture
Release Notes

Install

Overview

Prepare for Installation

Prerequisites
Download
Node Preprocessing
Installing
global Cluster Disaster Recovery

Upgrade

Overview
Pre-Upgrade Preparation
Upgrade the global cluster
Upgrade Workload Clusters

User Interface

Web Console

Overview
Accessing the Web Console
Customizing the Web Console
Customizing the Left Navigation
CLI Tools

Configure

Feature Gate

Clusters

Overview
Creating an On-Premise Cluster
etcd Encryption
Automated Rotate Kuberentes Certificates

How to

Add External Address for Built-in Registry
Choosing a Container Runtime
Updating Public Repository Credentials

Networking

Introduction

Architecture

Understanding Kube-OVN
Understanding ALB
Understanding MetalLB

Concepts

Auth
Ingress-nginx Annotation Compatibility
TCP/HTTP Keepalive
ModSecurity
Comparison Among Different Ingress Method
HTTP Redirect
L4/L7 Timeout
GatewayAPI
OTel

Guides

Creating Services
Creating Ingresses
Configure Gateway
Create Ingress-Nginx
Creating a Domain Name
Creating Certificates
Creating External IP Address Pool
Creating BGP Peers
Configure Subnets
Configure Network Policies
Creating Admin Network Policies
Configure Cluster Network Policies

How To

Deploy High Available VIP for ALB
Soft Data Center LB Solution (Alpha)
Preparing Kube-OVN Underlay Physical Network
Automatic Interconnection of Underlay and Overlay Subnets
Use OAuth Proxy with ALB
Creating GatewayAPI Gateway
Configure a Load Balancer
How to properly allocate CPU and memory resources
Forwarding IPv6 Traffic to IPv4 Addresses within the Cluster
Calico Network Supports WireGuard Encryption
Kube-OVN Overlay Network Supports IPsec Encryption
ALB Monitoring
Load Balancing Session Affinity Policy in Application Load Balancer (ALB)

Trouble Shooting

How to Solve Inter-node Communication Issues in ARM Environments?
Find Who Cause the Error

Machine Configuration

Overview
Managing Node Configuration with MachineConfig
Node Disruption Policies

Storage

Introduction

Concepts

Core Concepts
Persistent Volume
Access Modes and Volume Modes

Guides

Creating CephFS File Storage Type Storage Class
Creating CephRBD Block Storage Class
Create TopoLVM Local Storage Class
Creating an NFS Shared Storage Class
Deploy Volume Snapshot Component
Creating a PV
Creating PVCs
Using Volume Snapshots

How To

Setting the naming rules for subdirectories in the NFS Shared Storage Class
Generic ephemeral volumes
Using an emptyDir
Third‑Party Storage Capability Annotation Guide

Troubleshooting

Recover From PVC Expansion Failure

Storage

Ceph Distributed Storage

Introduction

Install

Create Standard Type Cluster
Create Stretch Type Cluster
Architecture

Concepts

Core Concepts

Guides

Accessing Storage Services
Managing Storage Pools
Node-specific Component Deployment
Adding Devices/Device Classes
Monitoring and Alerts

How To

Configure a Dedicated Cluster for Distributed Storage
Cleanup Distributed Storage

Disaster Recovery

File Storage Disaster Recovery
Block Storage Disaster Recovery
Object Storagge Disaster Recovery
Update the optimization parameters
Create ceph object store user

MinIO Object Storage

Introduction
Install
Architecture

Concepts

Core Concepts

Guides

Adding a Storage Pool
Monitoring & Alerts

How To

Data Disaster Recovery

TopoLVM Local Storage

Introduction
Install

Guides

Device Management
Monitoring and Alerting

How To

Backup and Restore TopoLVM Filesystem PVCs with Velero

Security

Alauda Container Security

Security and Compliance

Compliance

Introduction
Installation

HowTo

Private Registry Access Configuration
Image Signature Verification Policy
Image Signature Verification Policy with Secrets
Image Registry Validation Policy
Container Escape Prevention Policy
Security Context Enforcement Policy
Network Security Policy
Volume Security Policy

API Refiner

Introduction
Install

Users and Roles

User

Introduction

Guides

Manage User Roles
Create User
User Management

Group

Introduction

Guides

Manage User Group Roles
Create Local User Group
Manage Local User Group Membership

Role

Introduction

Guides

Create Role
Manage Custom Roles

IDP

Introduction

Guides

LDAP Management
OIDC Management

Troubleshooting

Delete User

User Policy

Introduction

Multitenancy(Project)

Introduction

Guides

Create Project
Manage Project
Manage Project Cluster
Manage Project Members

Audit

Introduction

Telemetry

Install

Virtualization

Virtualization

Overview

Introduction
Install

Images

Introduction

Guides

Adding Virtual Machine Images
Update/Delete Virtual Machine Images
Update/Delete Image Credentials

How To

Creating Windows Images Based on ISO using KubeVirt
Creating Linux Images Based on ISO Using KubeVirt
Exporting Virtual Machine Images
Permissions

Virtual Machine

Introduction

Guides

Creating Virtual Machines/Virtual Machine Groups
Batch Operations on Virtual Machines
Logging into the Virtual Machine using VNC
Managing Key Pairs
Managing Virtual Machines
Monitoring and Alerts
Quick Location of Virtual Machines

How To

Configuring USB host passthrough
Virtual Machine Hot Migration
Virtual Machine Recovery
Clone Virtual Machines on KubeVirt
Physical GPU Passthrough Environment Preparation
Configuring High Availability for Virtual Machines
Create a VM Template from an Existing Virtual Machine

Troubleshooting

Pod Migration and Recovery from Abnormal Shutdown of Virtual Machine Nodes
Hot Migration Error Messages and Solutions

Network

Introduction

Guides

Configure Network

How To

Control Virtual Machine Network Requests Through Network Policy
Configuring SR-IOV
Configuring Virtual Machines to Use Network Binding Mode for IPv6 Support

Storage

Introduction

Guides

Managing Virtual Disks

Backup and Recovery

Introduction

Guides

Using Snapshots

Developer

Overview

Quick Start

Creating a simple application via image

Building Applications

Concepts

Application Types
Custom Applications
Workload Types
Understanding Parameters
Understanding Environment Variables
Understanding Startup Commands
Resource Unit Description

Namespaces

Creating Namespaces
Importing Namespaces
Resource Quota
Limit Range
Pod Security Admission
Overcommit Ratio
Managing Namespace Members
Updating Namespaces
Deleting/Removing Namespaces

Creating Applications

Creating applications from Image
Creating applications from Chart
Creating applications from YAML
Creating applications from Code
Creating applications from Operator Backed
Creating applications by using CLI

Operation and Maintaining Applications

Application Rollout

Installing Alauda Container Platform Argo Rollouts
Application Blue Green Deployment
Application Canary Deployment
Status Description

KEDA(Kubernetes Event-driven Autoscaling)

KEDA Overview
Installing KEDA

How To

Integrating ACP Monitoring with Prometheus Plugin
Pausing Autoscaling in KEDA
Configuring HPA
Starting and Stopping Applications
Configuring VerticalPodAutoscaler (VPA)
Configuring CronHPA
Updating Applications
Exporting Applications
Updating and deleting Chart Applications
Version Management for Applications
Deleting Applications
Health Checks

Workloads

Deployments
DaemonSets
StatefulSets
CronJobs
Jobs
Pods
Containers
Working with Helm charts

Configurations

Configuring ConfigMap
Configuring Secrets

Application Observability

Monitoring Dashboards
Logs
Events

How To

Setting Scheduled Task Trigger Rules

Registry

Introduction

Install

Install Via YAML
Install Via Web UI

How To

Common CLI Command Operations
Using Alauda Container Platform Registry in Kubernetes Clusters

Source to Image

Introduction

Install

Installing Alauda Container Platform Builds

Upgrading

Upgrading Alauda Container Platform Builds
Architecture

Guides

Managing applications created from Code

How To

Creating an application from Code

Node Isolation Strategy

Introduction
Architecture

Concepts

Core Concepts

Guides

Create Node Isolation Strategy
Permissions
FAQ

GitOps

Introduction

Install

Installing Alauda Build of Argo CD
Installing Alauda Container Platform GitOps

Upgrade

Upgrading Alauda Container Platform GitOps
Architecture

Concepts

GitOps

Argo CD Concept

Introduction
Application
ApplicationSet
Tool
Helm
Kustomize
Directory
Sync
Health

Alauda Container Platform GitOps Concepts

Introduction
Alauda Container Platform GitOps Sync and Health Status

Guides

Creating GitOps Application

Creating GitOps Application
Creating GitOps ApplicationSet

GitOps Observability

Argo CD Component Monitoring
GitOps Applications Ops

How To

Integrating Code Repositories via Argo CD dashboard
Creating an Argo CD Application via Argo CD dashboard
Creating an Argo CD Application via the web console
How to Obtain Argo CD Access Information
Troubleshooting

Extend

Operator
Cluster Plugin

Observability

Overview

Monitoring

Introduction
Install

Architecture

Monitoring Module Architecture
Monitoring Component Selection Guide
Concepts

Guides

Management of Metrics
Management of Alert
Management of Notification
Management of Monitoring Dashboards
Management of Probe

How To

Backup and Restore of Prometheus Monitoring Data
VictoriaMetrics Backup and Recovery of Monitoring Data
Collect Network Data from Custom-Named Network Interfaces

Distributed Tracing

Introduction
Install
Architecture
Concepts

Guides

Query Tracing
Query Trace Logs

How To

Non-Intrusive Integration of Tracing in Java Applications
Business Log Associated with the TraceID

Troubleshooting

Unable to Query the Required Tracing
Incomplete Tracing Data

Logs

Introduction
Install

Architecture

Log Module Architecture
Log Component Selection Guide
Log Component Capacity Planning
Concepts

Guides

Logs

How To

How to Archive Logs to Third-Party Storage
How to Interface with External ES Storage Clusters

Events

Introduction
Events

Inspection

Introduction
Architecture

Guides

Inspection
Component Health Status

Hardware accelerators

Overview

Introduction
Features
Install

Application Development

Introduction

Guides

CUDA Driver and Runtime Compatibility
Add Custom Devices Using ConfigMap

Troubleshooting

Troubleshooting float16 is only supported on GPUs with compute capability at least xx Error in vLLM
Paddle Autogrow Memory Allocation Crash on GPU-Manager

Configuration Management

Introduction

Guides

Configure Hardware accelerator on GPU nodes

Resource Monitoring

Introduction

Guides

GPU Resource Monitoring

Alauda Service Mesh

About Alauda Service Mesh

Alauda AI

About Alauda AI

Alauda DevOps

About Alauda DevOps

Alauda Cost Management

About Alauda Cost Management

Alauda Application Services

Overview

Introduction
Architecture
Install
Upgrade

Alauda Database Service for MySQL

About Alauda Database Service for MySQL-MGR
About Alauda Database Service for MySQL-PXC

Alauda Cache Service for Redis OSS

About Alauda Cache Service for Redis OSS

Alauda Streaming Service for Kafka

About Alauda Streaming Service for Kafka

Alauda Streaming Service for RabbitMQ

About Alauda Streaming Service for RabbitMQ

Alauda support for PostgreSQL

About Alauda support for PostgreSQL

Operations Management

Introduction

Parameter Template Management

Introduction

Guides

Parameter Template Management

Backup Management

Introduction

Guides

External S3 Storage
Backup Management

Inspection Management

Introduction

Guides

Create Inspection Task
Exec Inspection Task
Update and Delete Inspection Tasks

How To

How to set Inspection scheduling?

Inspection Optimization Recommendations

MySQL

MySQL IO Load Optimization
MySQL Memory Usage Optimization
MySQL Storage Space Optimization
MySQL Active Thread Count Optimization
MySQL Row Lock Optimization

Redis

Redis BigKey
High CPU Usage in Redis
High Memory Usage in Redis

Kafka

High CPU Utilization in Kafka
Kafka Rebalance Optimization
Kafka Memory Usage Optimization
Kafka Storage Space Optimization

RabbitMQ

RabbitMQ Mnesia Database Exception Handling

Alert Management

Introduction

Guides

Relationship with Platform Capabilities

Upgrade Management

Introduction

Guides

Instance Upgrade

API Reference

Overview

Introduction
Kubernetes API Usage Guide

Advanced APIs

Alert APIs

AlertHistories [v1]
AlertHistoryMessages [v1]
AlertStatus [v2]
SilenceStatus [v2]

Event APIs

Search

Log APIs

Aggregation
Archive
Context
Search

Monitoring APIs

Indicators [monitoring.alauda.io/v1beta1]
Metrics [monitoring.alauda.io/v1beta1]
Variables [monitoring.alauda.io/v1beta1]

Kubernetes APIs

Alert APIs

AlertTemplate [alerttemplates.aiops.alauda.io/v1beta1]
PrometheusRule [prometheusrules.monitoring.coreos.com/v1]

Inspection APIs

Inspection [inspections.ait.alauda.io/v1alpha1]

Notification APIs

Notification [notifications.ait.alauda.io/v1beta1]
NotificationGroup [notificationgroups.ait.alauda.io/v1beta1]
NotificationTemplate [notificationtemplates.ait.alauda.io/v1beta1]
📝 Edit this page on GitHub
Previous PageGatewayAPI
Next PageGuides

#OTel

OpenTelemetry (OTel) is an open-source project aimed at providing a vendor-neutral standard for collecting, processing, and exporting telemetry data in distributed systems, such as microservices architectures. It helps developers analyze the performance and behavior of software more easily, thus facilitating the diagnosis and resolution of application issues.

#TOC

#Terminology

TermExplanation
TraceThe data submitted to the OTel Server, which is a collection of related events or operations used to track the flow of requests in distributed systems; each Trace consists of multiple Spans.
SpanAn independent operation or event within a Trace that includes start time, duration, and other relevant information.
OTel ServerAn OTel server capable of receiving and storing Trace data, such as Jaeger, Prometheus, etc.
JaegerAn open-source distributed tracing system used for monitoring and troubleshooting microservices architectures, supporting integration with OpenTelemetry.
AttributesKey-value pairs attached to a Trace or Span to provide additional contextual information. This includes Resource Attributes and Span Attributes; see Attributes for more information.
SamplerA strategy component that determines whether to sample and report a Trace. Different sampling strategies can be configured, such as full sampling, proportional sampling, etc.
ALB (Another Load Balancer)A software or hardware device that distributes network requests across available nodes in a cluster; the load balancer (ALB) used in the platform is a layer 7 software load balancer, which can be configured to monitor traffic with OTel. ALB supports submitting Traces to a specified Collector and allows different sampling strategies; it also supports configuring whether to submit Traces at the Ingress level.
FT (Frontend)The port configuration for ALB, specifying port-level configurations.
RuleRouting rules on the port (FT) used to match specific routes.
HotROD (Rides on Demand)A sample application provided by Jaeger to demonstrate the use of distributed tracing; refer to Hot R.O.D. - Rides on Demand for more details.
hotrod-with-proxySpecifies the addresses of HotROD's internal microservices via environment variables; refer to hotrod-with-proxy for more details.

#Prerequisites

  • Ensure that an operable ALB exists: Create or use an existing ALB, where the name of the ALB is replaced with <otel-alb> in this document. For instructions on creating an ALB, refer to Creating Load Balancer.

  • Ensure that there is an OTel data reporting server address: This address will hereinafter be referred to as <jaeger-server>.

#Procedure

#Update ALB Configuration

  1. On the Master node of the cluster, use the CLI tool to execute the following command to edit the ALB configuration.

    kubectl edit alb2 -n cpaas-system <otel-alb> # Replace <otel-alb> with the actual ALB name
  2. Add the following fields under the spec.config section.

    otel:
      enable: true
      exporter:
        collector:
          address: "<jaeger-server>" # Replace <jaeger-server> with the actual OTel data reporting server address
          request_timeout: 1000

    Example configuration once completed:

    spec:
      address: 192.168.1.1
      config:
        otel:
         enable: true
         exporter:
           collector:
             address: "http://jaeger.default.svc.cluster.local:4318"
             request_timeout: 1000
        antiAffinityKey: system
        defaultSSLCert: cpaas-system/cpaas-system
        defaultSSLStrategy: Both
        gateway:
        ...
    type: nginx
  3. Execute the following command to save the updates. After the update, the ALB will default to enabling OpenTelemetry, and all request Trace information will be reported to the Jaeger Server.

    :wq

#Related Operations

#Configuring OTel in Ingress

  • Enable or Disable OTel on Ingress

    By configuring whether to enable OTel on Ingress, you can better monitor and debug the request flow of applications, identifying performance bottlenecks or errors by tracing requests as they propagate between different services.

    Procedure

    Add the following configuration under the metadata.annotations field of Ingress:

    nginx.ingress.kubernetes.io/enable-opentelemetry: "true"

    Parameter Explanation:

    • nginx.ingress.kubernetes.io/enable-opentelemetry: When set to true, it indicates that the Ingress controller enables OpenTelemetry functionality while processing requests through this Ingress, which means request Trace information will be collected and reported. When set to false or this annotation is removed, it means that request Trace information will not be collected or reported.
  • Enable or Disable OTel Trust on Ingress

    OTel Trust determines whether Ingress trusts and uses the Trace information (e.g., trace ID) from incoming requests.

    Procedure

    Add the following configuration under the metadata.annotations field of Ingress:

    nginx.ingress.kubernetes.io/opentelemetry-trust-incoming-span: "true"

    Parameter Explanation:

    • nginx.ingress.kubernetes.io/opentelemetry-trust-incoming-span: When set to true, the Ingress continues to use already existing Trace information, helping maintain consistency in cross-service tracing, allowing the entire request chain to be fully traced and analyzed in the distributed tracing system. When set to false, it will generate new tracing information for the request, which may cause the request to be treated as part of a new tracing chain after entering the Ingress, interrupting cross-service trace continuity.
  • Add Different OTel Configurations on Ingress

    This configuration allows you to customize OTel's behavior and data export methodology for different Ingress resources, enabling fine-grained control over each service's tracing strategy or target.

    Procedure

    Add the following configuration under the metadata.annotations field of Ingress:

    apiVersion: networking.k8s.io/v1
    kind: Ingress
    metadata:
      annotations:
        alb.ingress.cpaas.io/otel: >
          {
             "enable": true,
             "exporter": {
                 "collector": {
                     "address": "<jaeger-server>", # Replace <jaeger-server> with the actual OTel data reporting server address, e.g., "address": "http://128.0.0.1:4318"
                     "request_timeout": 1000
                 }
             }
          }

    Parameter Explanation:

    • exporter: Specifies how the collected Trace data is sent to the OTel Collector (the OTel data reporting server).
    • address: Specifies the address of the OTel Collector.
    • request_timeout: Specifies the request timeout.

#Using OTel in Applications

The following configuration shows the complete OTel configuration structure, which can be used to define how to enable and use OTel features in applications.

On the cluster Master node, use the CLI tool to execute the following command to get the complete OTel configuration structure.

kubectl get crd alaudaloadbalancer2.crd.alauda.io -o json|jq ".spec.versions[2].schema.openAPIV3Schema.properties.spec.properties.config.properties.otel"

Echoed Result:

{
    "otel": {
        "enable": true
    }
    "exporter": {
        "collector": {
            "address": ""
          },
    },
    "flags": {
        "hide_upstream_attrs": false
        "notrust_incoming_span": false
        "report_http_request_header": false
        "report_http_response_header": false
    },
    "sampler": {
        "name": "",
        "options": {
            "fraction": ""
            "parent_name": ""
          },
      },
 }

Parameter Explanation:

ParameterDescription
otel.enableWhether to enable OTel functionality.
exporter.collector.addressThe address of the OTel data reporting server, supporting http/https protocols and domain names.
flags.hide_upstream_attrsWhether to report information about upstream rules.
flag.notrust_incoming_spanWhether to trust and use the OTel Trace information (e.g., trace ID) from incoming requests.
flags.report_http_request_headerWhether to report request headers.
flags.report_http_response_headerWhether to report response headers.
sampler.nameSampling strategy name; see Sampling Strategies for details.
sampler.options.fractionSampling rate.
sampler.options.parent_nameThe parent strategy for parent_base sampling strategies.

#Inheritance

By default, if the ALB configures certain OTel parameters and FT is not configured, FT will inherit the parameters from the ALB as its own configuration; that is, FT inherits the ALB configuration, while Rule can inherit configurations from both ALB and FT.

  • ALB: The configuration on the ALB is typically global and default. You can configure global parameters such as Collector addresses here, which will be inherited by the lower-level FT and Rule.

  • FT: FT can inherit configurations from ALB, meaning that certain OTel parameters that are not configured on FT will use the configuration from ALB. However, FT can also be refined further; for instance, you can choose to selectively enable or disable OTel on FT without affecting other FT or the global settings of ALB.

  • Rule: Rule can inherit configurations from both ALB and FT. However, Rule can also be refined further; for instance, a specific Rule can choose not to trust the incoming OTel Trace information or to adjust the sampling strategies.

Procedure

By configuring the spec.config.otel field in the YAML files of ALB, FT, and Rule, you can add OTel-related configuration.

#Additional Notes

#Sampling Strategies

ParameterExplanation
always onAlways report all tracing data.
always offNever report tracing data.
traceid-ratioDecide whether to report based on traceid. The format of traceparent is xx-traceid-xx-flag, where the first 16 characters of traceid represent a 32-bit hexadecimal integer. If this integer is less than fraction multiplied by 4294967295 (i.e., (2^32-1)), it will be reported.
parent-baseDecide whether to report based on the flag part of the traceparent in the request. When the flag is 01, it will be reported; for example: curl -v "http://$ALB_IP/" -H 'traceparent: 00-xx-xx-01'; when the flag is 02, it will not be reported; for example: curl -v "http://$ALB_IP/" -H 'traceparent: 00-xx-xx-02'.

#Attributes

  • Resource Attributes

    These attributes are reported by default.

    ParameterDescription
    hostnameThe hostname of the ALB Pod
    service.nameThe name of the ALB
    service.namespaceThe namespace where the ALB resides
    service.typeDefault is ALB
    service.instance.idThe name of the ALB Pod
  • Span Attributes

    • Attributes reported by default:

      ParameterDescription
      http.status_codeStatus code
      http.request.resend_countRetry count
      alb.rule.rule_nameThe name of the rule matched by this request
      alb.rule.source_typeThe type of the rule matched by this request, currently only Ingress
      alb.rule.source_nameThe name of the Ingress
      alb.rule.source_nsThe namespace where the Ingress resides
    • Attributes reported by default but can be excluded by modifying the flag.hide_upstream_attrs field:

      ParameterDescription
      alb.upstream.svc_nameThe name of the Service (internal route) to which traffic is forwarded
      alb.upstream.svc_nsThe namespace where the Service (internal route) being forwarded resides
      alb.upstream.peerThe IP address and port of the Pod being forwarded to
    • Attributes not reported by default but can be reported by modifying the flag.report_http_request_header field:

      ParameterDescription
      **http.request.header.<header>**Request Header
    • Attributes not reported by default but can be reported by modifying the flag.report_http_response_header field:

      ParameterDescription
      **http.response.header.<header>**Response Header

#Configuration Example

The following YAML configuration deploys an ALB and uses Jaeger as the OTel server, with Hotrod-proxy as the demonstration backend. By configuring Ingress rules, when clients request the ALB, the traffic will be forwarded to HotROD. Additionally, the communication between internal microservices of HotROD is also routed through the ALB.

  1. Save the following YAML as a file named all.yaml.

    apiVersion: apps/v1
    kind: Deployment
    metadata:
      name: hotrod
    spec:
      replicas: 1
      selector:
        matchLabels:
          service.cpaas.io/name: hotrod
          service_name: hotrod
      template:
        metadata:
          labels:
            service.cpaas.io/name: hotrod
            service_name: hotrod
        spec:
          containers:
            - name: hotrod
              env:
                - name: PROXY_PORT
                  value: "80"
                - name: PROXY_ADDR
                  value: "otel-alb.default.svc.cluster.local:"
                - name: OTEL_EXPORTER_OTLP_ENDPOINT
                  value: "http://jaeger.default.svc.cluster.local:4318"
              image: theseedoaa/hotrod-with-proxy:latest
              imagePullPolicy: IfNotPresent
              command: ["/bin/hotrod", "all", "-v"]
    ---
    apiVersion: networking.k8s.io/v1
    kind: Ingress
    metadata:
      name: hotrod-frontend
    spec:
      ingressClassName: otel-alb
      rules:
        - http:
            paths:
              - backend:
                  service:
                    name: hotrod
                    port:
                      number: 8080
                path: /dispatch
                pathType: ImplementationSpecific
              - backend:
                  service:
                    name: hotrod
                    port:
                      number: 8080
                path: /frontend
                pathType: ImplementationSpecific
    ---
    apiVersion: networking.k8s.io/v1
    kind: Ingress
    metadata:
      name: hotrod-customer
    spec:
      ingressClassName: otel-alb
      rules:
        - http:
            paths:
              - backend:
                  service:
                    name: hotrod
                    port:
                      number: 8081
                path: /customer
                pathType: ImplementationSpecific
    ---
    apiVersion: networking.k8s.io/v1
    kind: Ingress
    metadata:
      name: hotrod-route
    spec:
      ingressClassName: otel-alb
      rules:
        - http:
            paths:
              - backend:
                  service:
                    name: hotrod
                    port:
                      number: 8083
                path: /route
                pathType: ImplementationSpecific
    ---
    apiVersion: v1
    kind: Service
    metadata:
      name: hotrod
    spec:
      internalTrafficPolicy: Cluster
      ipFamilies:
        - IPv4
      ipFamilyPolicy: SingleStack
      ports:
        - name: frontend
          port: 8080
          protocol: TCP
          targetPort: 8080
        - name: customer
          port: 8081
          protocol: TCP
          targetPort: 8081
        - name: router
          port: 8083
          protocol: TCP
          targetPort: 8083
      selector:
        service_name: hotrod
      sessionAffinity: None
      type: ClusterIP
    ---
    apiVersion: apps/v1
    kind: Deployment
    metadata:
      name: jaeger
    spec:
      replicas: 1
      selector:
        matchLabels:
          service.cpaas.io/name: jaeger
          service_name: jaeger
      template:
        metadata:
          labels:
            service.cpaas.io/name: jaeger
            service_name: jaeger
        spec:
          containers:
            - name: jaeger
              env:
                - name: LOG_LEVEL
                  value: debug
              image: jaegertracing/all-in-one:1.58.1
              imagePullPolicy: IfNotPresent
          hostNetwork: true
          tolerations:
            - operator: Exists
    ---
    apiVersion: v1
    kind: Service
    metadata:
      name: jaeger
    spec:
      internalTrafficPolicy: Cluster
      ipFamilies:
        - IPv4
      ipFamilyPolicy: SingleStack
      ports:
        - name: http
          port: 4318
          protocol: TCP
          targetPort: 4318
      selector:
        service_name: jaeger
      sessionAffinity: None
      type: ClusterIP
    ---
    apiVersion: crd.alauda.io/v2
    kind: ALB2
    metadata:
      name: otel-alb
    spec:
      config:
        loadbalancerName: otel-alb
        otel:
          enable: true
          exporter:
            collector:
              address: "http://jaeger.default.svc.cluster.local:4318"
              request_timeout: 1000
        projects:
          - ALL_ALL
        replicas: 1
        resources:
          alb:
            limits:
              cpu: 200m
              memory: 2Gi
            requests:
              cpu: 50m
              memory: 128Mi
          limits:
            cpu: "1"
            memory: 1Gi
          requests:
            cpu: 50m
            memory: 128Mi
      type: nginx
  2. In the CLI tool, execute the following command to deploy Jaeger, ALB, HotROD, and all necessary CRs for testing.

    kubectl apply ./all.yaml
  3. Execute the following command to get the access address of Jaeger.

    export JAEGER_IP=$(kubectl get po -A -o wide |grep jaeger | awk '{print $7}');echo "http://$JAEGER_IP:16686"
  4. Execute the following command to obtain the access address of otel-alb.

    export ALB_IP=$(kubectl get po -A -o wide|grep otel-alb | awk '{print $7}');echo $ALB_IP
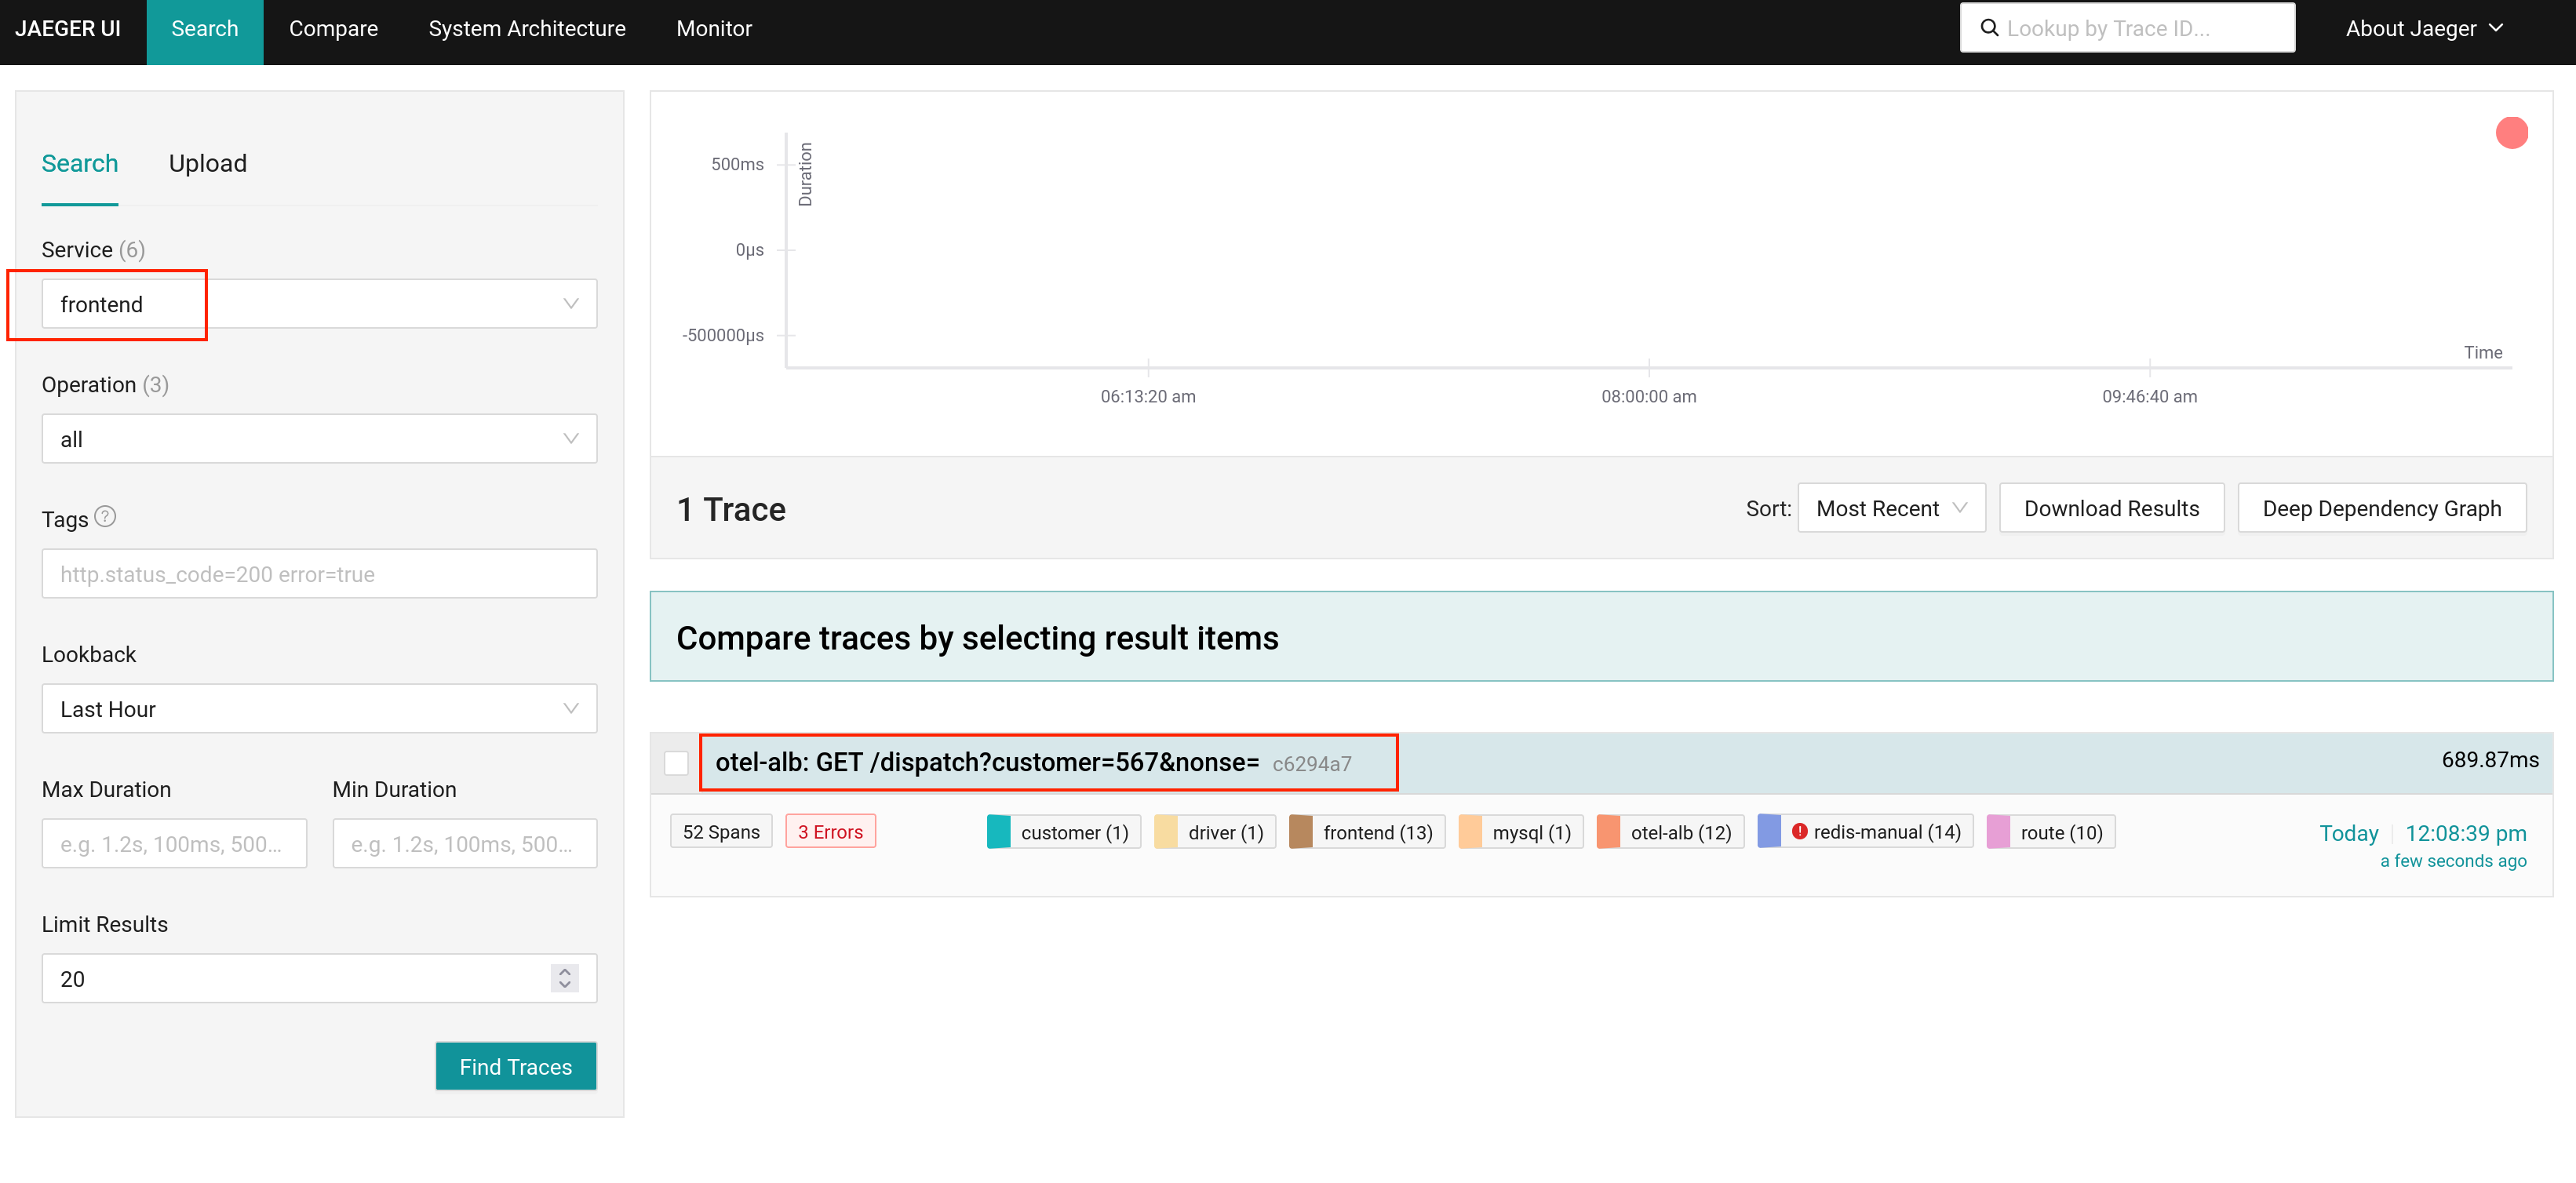
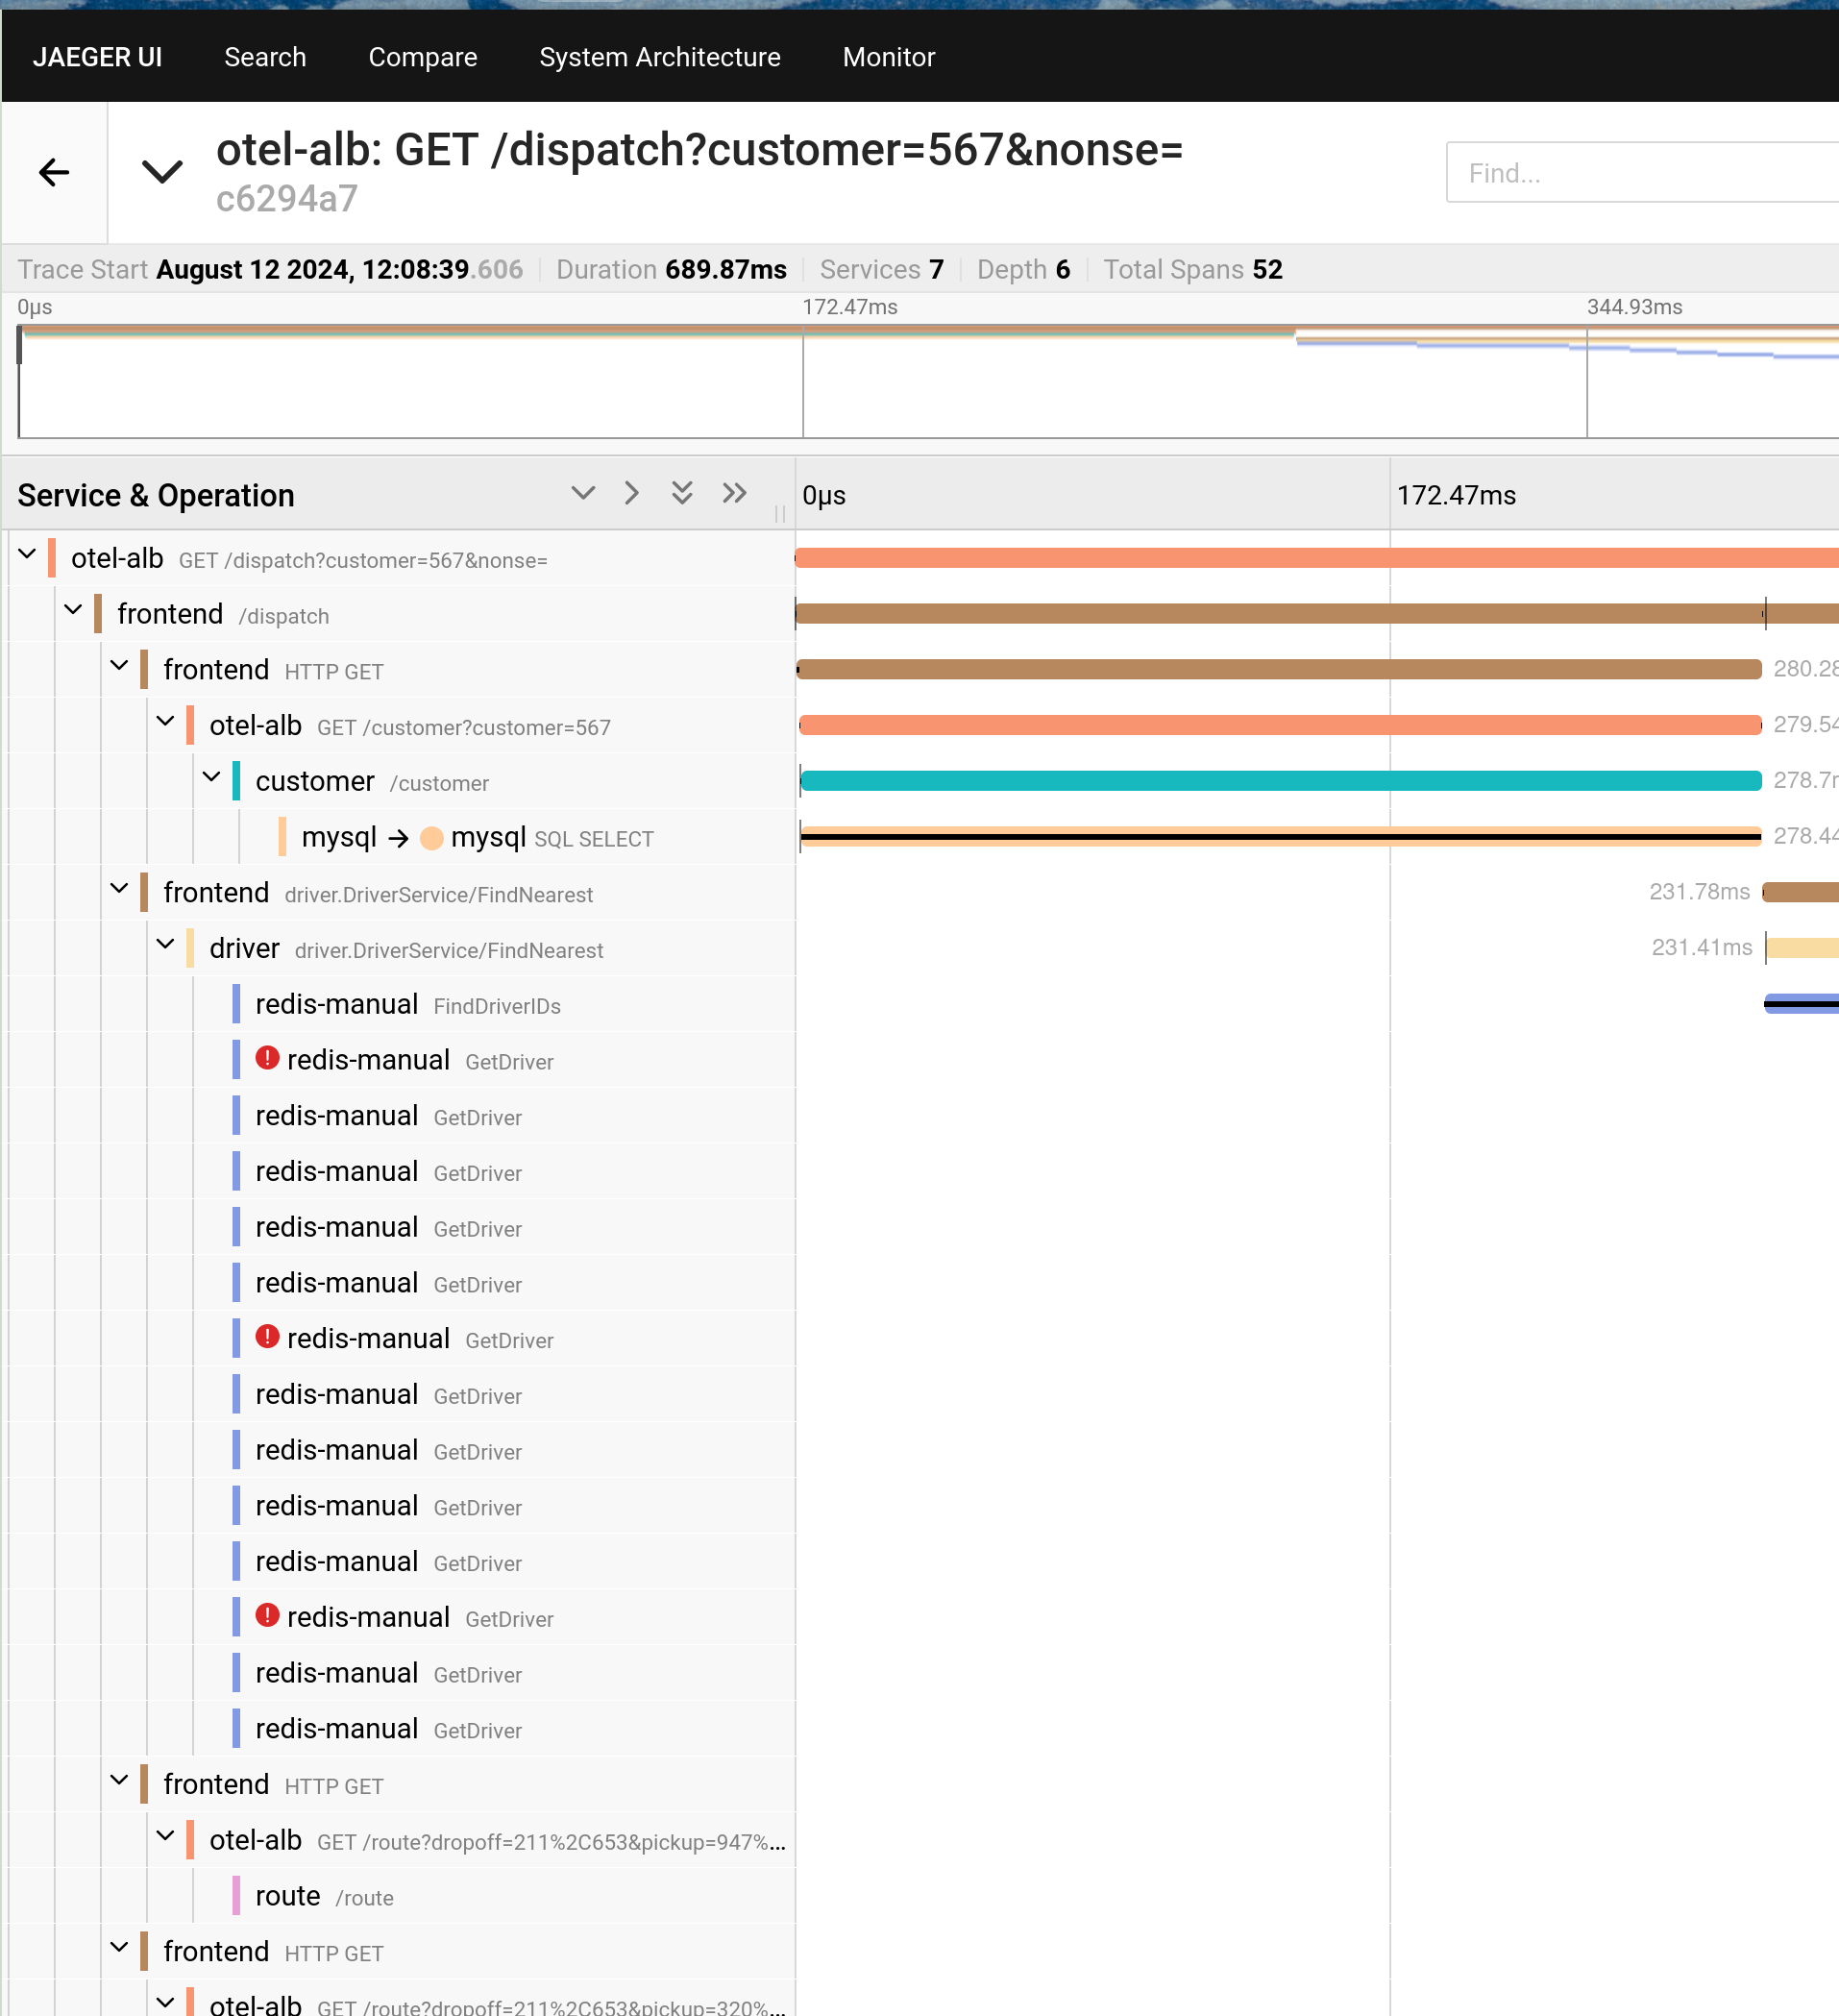
  5. Execute the following command to send a request to HotROD via ALB. Here, ALB will report the Trace to Jaeger.

    curl -v "http://<$ALB_IP>:80/dispatch?customer=567&nonse=" # Replace <$ALB_IP> in the command with the access address of otel-alb obtained in the previous procedure
  6. Open the access address of Jaeger obtained in Step 3 to view the results.